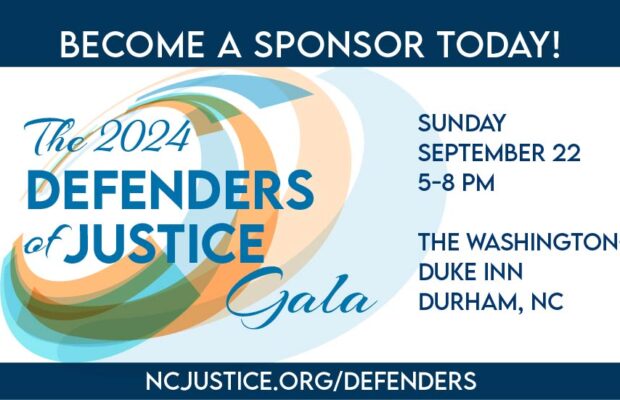
 Defenders of Justice
Join us for the 2024 Greensboro Champion of Justice Reception
Click here to learn more and become a sponsor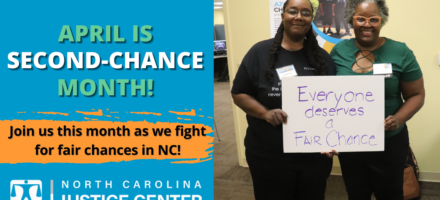
April is Second Chance Month
Help us fight for fair chances in NC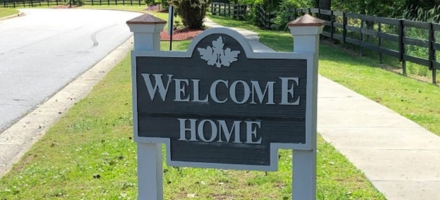
Settlement approved for residents of mobile home park in Garner
Garner residents to be compensated by Riverstone Communities, LLC
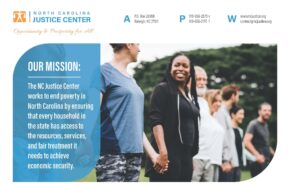
Welcome to the North Carolina Justice Center
Our mission is to eliminate poverty in North Carolina by ensuring that every household in the state has access to the resources, services, and fair treatment it needs to achieve economic security.
Explore Projects


Latest News
View All NewsUpcoming Events

A great resource to help educate North Carolina voters and policy leaders. The Center promotes advocacy for equitable solutions to real issues faced by the state.