 Defenders of Justice

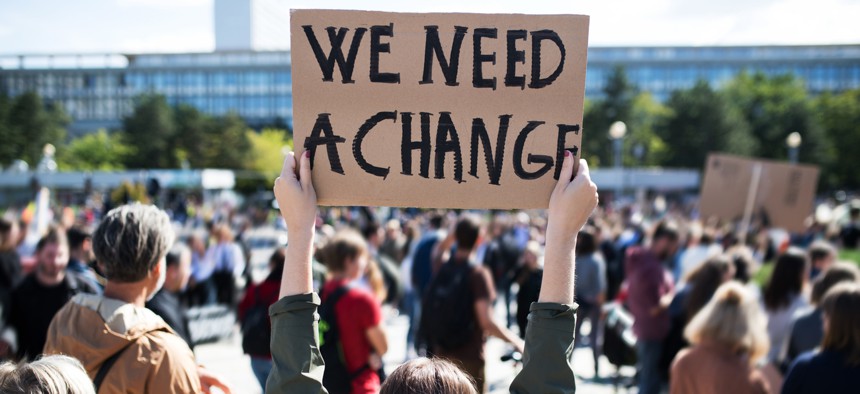
Greener roads for all: Making EVs work for every community
Learn more about the Equitable EV Framework
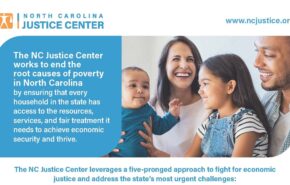
Welcome to the North Carolina Justice Center
Our mission is to eliminate poverty in North Carolina by ensuring that every household in the state has access to the resources, services, and fair treatment it needs to achieve economic security.
News & Commentary
Upcoming Events


2025 Defenders of Justice Gala
The Washington Duke Inn


Explore Projects
A great resource to help educate North Carolina voters and policy leaders. The Center promotes advocacy for equitable solutions to real issues faced by the state.