 Defenders of Justice
The COVID-19 pandemic requires a moral response that targets the root causes of longstanding poverty and inequity to bring shared prosperity to all North Carolinians.
Introduction
The COVID-19 pandemic has created an unprecedented economic crisis with widespread job and income losses that have magnified the already extreme racial, gender, and income inequities in our economy. The recession caused by the pandemic is increasing hardship in North Carolina and across the country and has the potential to further entrench poverty and economic injustice.
At the same time, COVID-19 has revealed how dependent we are on one another. It has shown the essential nature of people’s labor in jobs that are undervalued — both in pay and culturally. These positions, like supermarket cashiers, food processing workers, and child caregivers, are disproportionately held by women, people of color, and immigrants. The pandemic has revealed the common sense necessity of ensuring that people can stay home from work when they are sick — without losing pay — because these policies protect everyone’s health. And the pandemic has shown us the incalculable value of a robust social safety net that protects families from going hungry or becoming homeless during a financial crisis.
In 2019, 13.6 percent of North Carolinians lived in poverty — an income of just $25,750 for a family of four. This means the state entered the pandemic with more than 1.4 million residents in poverty, and many more North Carolinians are likely to experience poverty during their lifetimes. Far from being an issue affecting a small percentage of people, nearly 3 in 5 Americans will experience poverty at some point in adulthood.[1] This report reviews the latest available data on poverty and hardship in North Carolina, including:
- American Community Survey data on poverty and income in 2019 that show stark racial inequities and a lopsided economy where the wealthiest people benefit the most from economic growth.
- How the poverty level compares to a true Living Income Standard of nearly $53,000.
- Analysis showing that safety net programs can cut poverty in half.
- Widespread food insecurity and housing instability during the COVID-19 pandemic, shown in the results of the new Household Pulse Survey.
- Employment data indicating that while high wage jobs have fully recovered since February, there are 17 percent fewer low wage jobs available.
Poverty limits the potential of our communities. We all want to live in a state where every North Carolinian — Black, brown, and white — can thrive, and that means making policy choices focused on lifting people out of poverty. Many people and organizations are already pushing for these changes and organizing across race, income, and geography to demand an equitable and anti-racist economy. The data in this report can be one tool for building a very different recovery from the one after the Great Recession, which left low-income people and people of color behind. Instead, we need a racially equitable recovery that’s focused on the people who have been harmed the most, that leads to high quality, living-wage jobs for the people who currently have the lowest earnings, and that creates a robust social safety net to ensure North Carolina families can weather emergencies.
2019 data show that 1 in 7 North Carolinians entered the COVID-19 pandemic already experiencing poverty
The latest American Community Survey data from the U.S. Census released in September 2020 tells us what was happening in North Carolina in 2019.[2] This year, because of the economic devastation caused by the COVID-19 pandemic beginning in March, the data do not paint an accurate picture of poverty or hardship in the state, but the data do show us that the state entered the pandemic and its associated recession with high rates of poverty and racial inequality.
North Carolina didn’t use the economic expansion to meaningfully address poverty
After the Great Recession, the United States experienced the longest economic expansion on record, beginning in 2009 and ending with the COVID-19 pandemic in early 2020. In North Carolina, we didn’t use that economic growth to expand key safety net policies like Medicaid and unemployment insurance or to raise the minimum wage so that work would provide people with enough income to cover their basic needs.
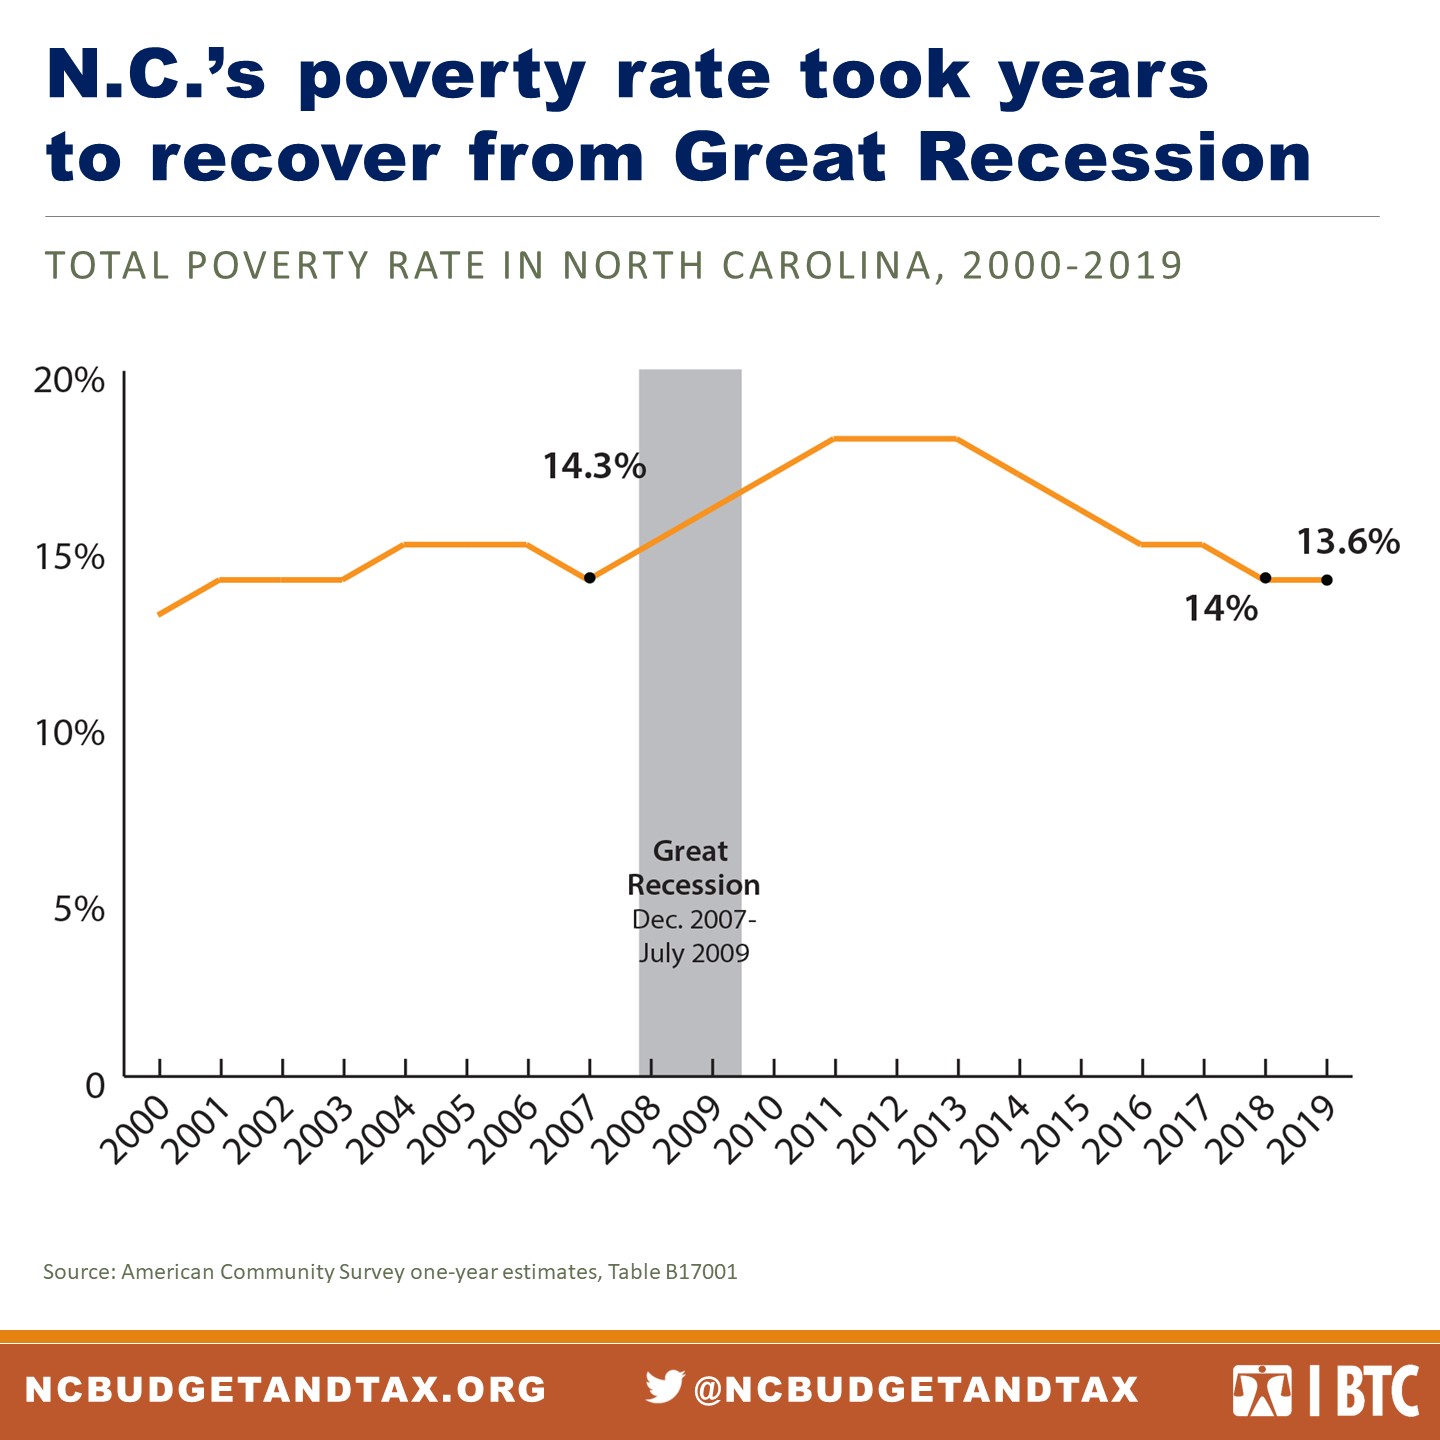
In 2019, 1.4 million North Carolinians, or about 1 in every 7 people in the state, lived in poverty.[3] As shown in Figure 1, the poverty rate barely budged from 2018 to 2019, falling by just 0.4 percentage points from 14 percent to 13.6 percent.[4]
In North Carolina and across the United States, poverty rates shot up when the Great Recession began in December 2007. Although the Great Recession ended in June 2009 according to standard measures of economic growth, low and middle-income people and especially Black and Latinx[5] families felt its effects for years after that.[6] In North Carolina, the poverty rate continued to climb until 2012, peaking at over 18 percent and only returning to pre-recession poverty levels in 2018.
North Carolina has long had higher poverty rates than the United States as a whole: In 2019, the state had the 13th highest poverty rate in the country, and at 13.6 percent, the poverty rate was 3 percentage points higher than the U.S. rate of 10.5 percent.[7]
These statistics do not reflect a lack of wealth. North Carolina has the 12th largest economy in the country, and along with the rest of the nation, its economy grew steadily from 2012 to 2019.[8] But without policies that target the root causes of poverty, growth on its own is not enough to create shared prosperity. Rather, more wealth is concentrated among people who are already at the top: In 2019, over half of the total income in North Carolina was captured by the richest 20 percent of residents.[9] Nearly one quarter of total state income went to the top 5 percent richest residents.[10]
Inequitable economic growth is a problem not only because it harms people who are left behind but also because it’s unsustainable. When people who are already rich capture economic gains, they are much more likely to save that money than spend it. A stable economy needs a broad base of consumer spending, which will only grow with increased earnings for low- and middle-income people.[11]
Poverty rates by race and gender reflect structural inequities in the economy
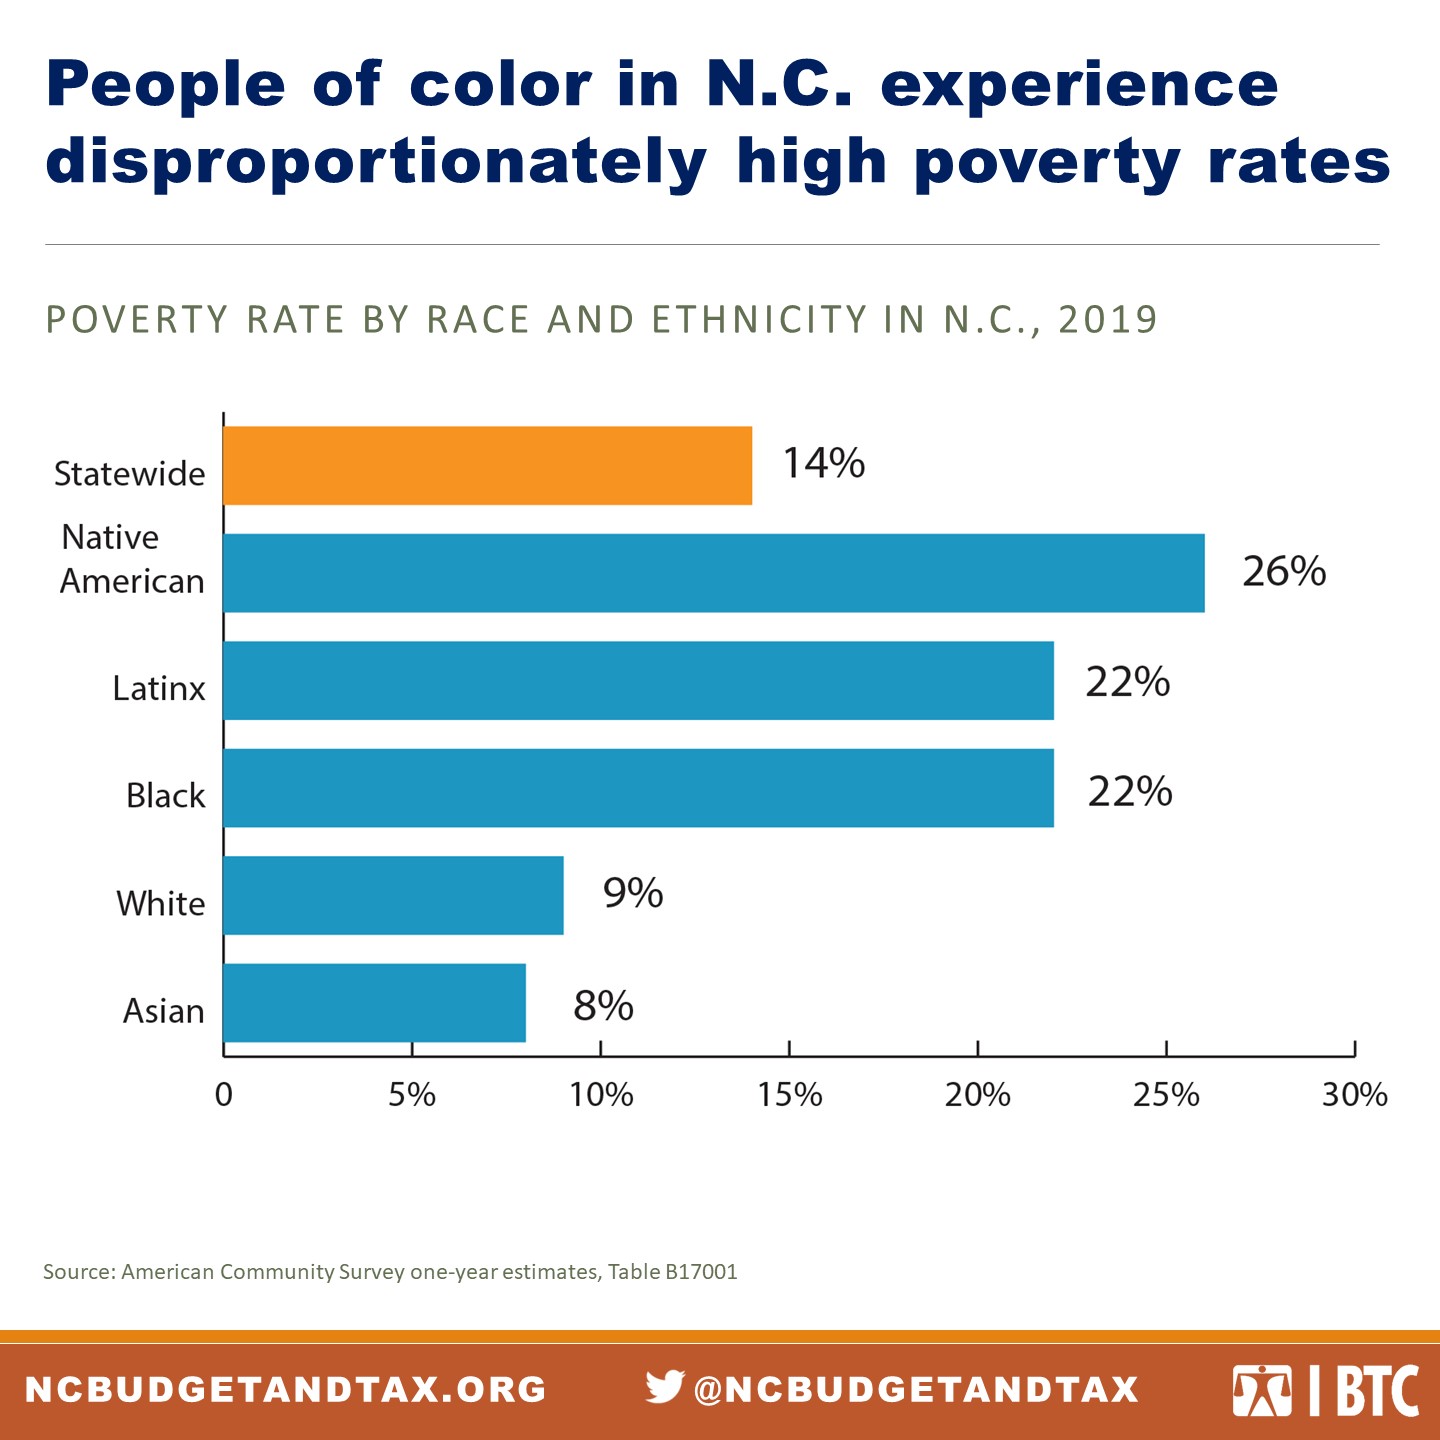
The overall poverty rate masks major inequities by race, as shown in Figure 2. The poverty rate is significantly higher for Black, Latinx, and Native American North Carolinians with 1 out of 4 Native Americans in the state and 1 out of 5 Black and Latinx people living in poverty in 2019.[12]
These disparities reflect long-standing structural inequities in education, housing, and the labor market that have advantaged white people’s incomes and accumulation of wealth in the United States. This long history begins with the theft of Native American land and enslavement of Black Africans and continues through many present-day policies that continue to advantage white people even though the policies appear to be “race neutral.” These include a tax code that benefits homeowners and people with intergenerational wealth, as well as an insufficient social safety net and zoning policies that reinforce racial residential segregation and access to key resources like high quality public schools and good jobs.
 Higher rates of poverty among women are connected to the lack of support for working parents
The poverty rate among North Carolina women is more than 20 percent higher than for men. In 2019:[13]
- 786,000 women, or 14.9 percent, experienced poverty.
- 600,000 men, or 12.2 percent, experienced poverty.
Higher poverty rates among women are related to a wage gap that is even more severe for many women of color. Women’s labor is undervalued in our economy, and women are more likely to work jobs that pay low wages and don’t provide high quality benefits. Work like child care that is disproportionately done by women, especially women of color, is more likely be viewed as “low skilled” even when our society is entirely dependent on it.[14]
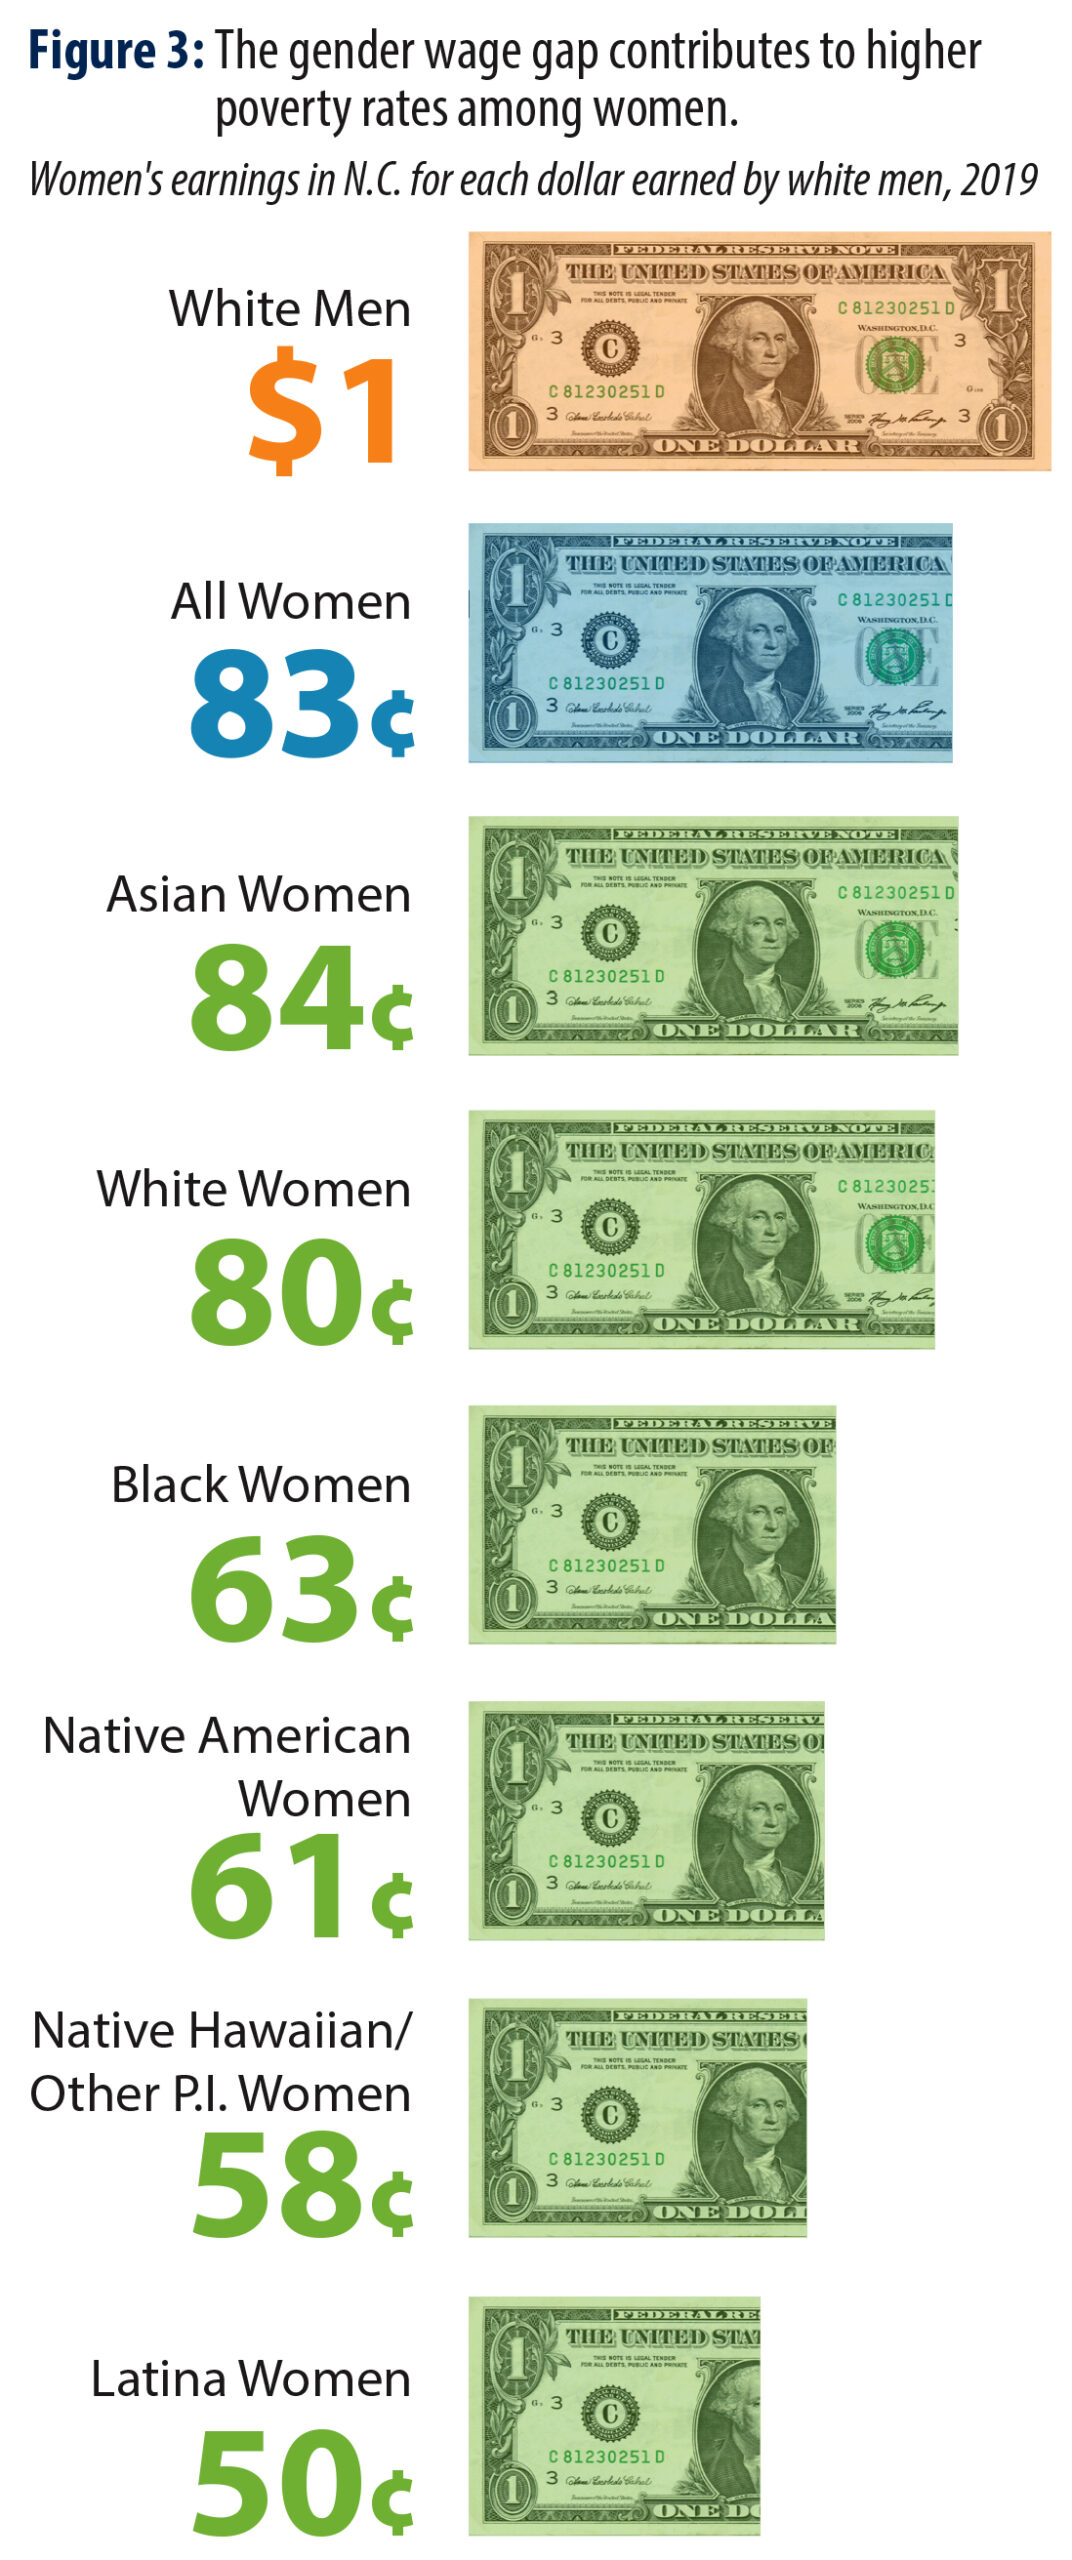
As shown in Figure 3, women in North Carolina overall make about 83 cents for every dollar that a white man makes, but Black women make 63 cents, and Latina women make just 50 cents. Women also contribute far more unpaid care work — for children, elders, and other family members — than men. Without comprehensive family and sick-leave policies women are often forced to work fewer hours or leave the workforce entirely.[15]
COVID-19 has magnified gender inequalities in the labor market in unprecedented ways, with women in North Carolina being far more likely to file for unemployment than men during the peak of job losses in April 2020.[16] This recession has been uniquely harmful for all women, especially women of color, who are more likely to work in occupations that have faced the greatest job losses, such as retail, food service, and hospitality.[17] Simultaneously, the closing of schools and child care programs has made it impossible for many mothers to continue working in essential jobs that cannot be done remotely or to work from home while also caring for their children. Loss of jobs or work hours among women has the potential not only to set back progress toward economic gender equity but to harm children in families where women are the primary earners.
Policies that improve conditions for women of color can boost everyone. Men also benefit from family-leave policies that enable them to form stronger bonds with their children and better relationships with co-parents.[18] Ensuring that women of color, who have been most disadvantaged in the labor market, are thriving would mean the economy was working for everyone.
Young children have the highest poverty rate of any age group
Our communities do best when kids have what they need for safe and healthy development and when families are thriving so that no child lives in poverty. But poverty rates by age reveal persistently high levels of childhood poverty, showing that North Carolina has work to do to address the well-being of some of the state’s youngest residents.
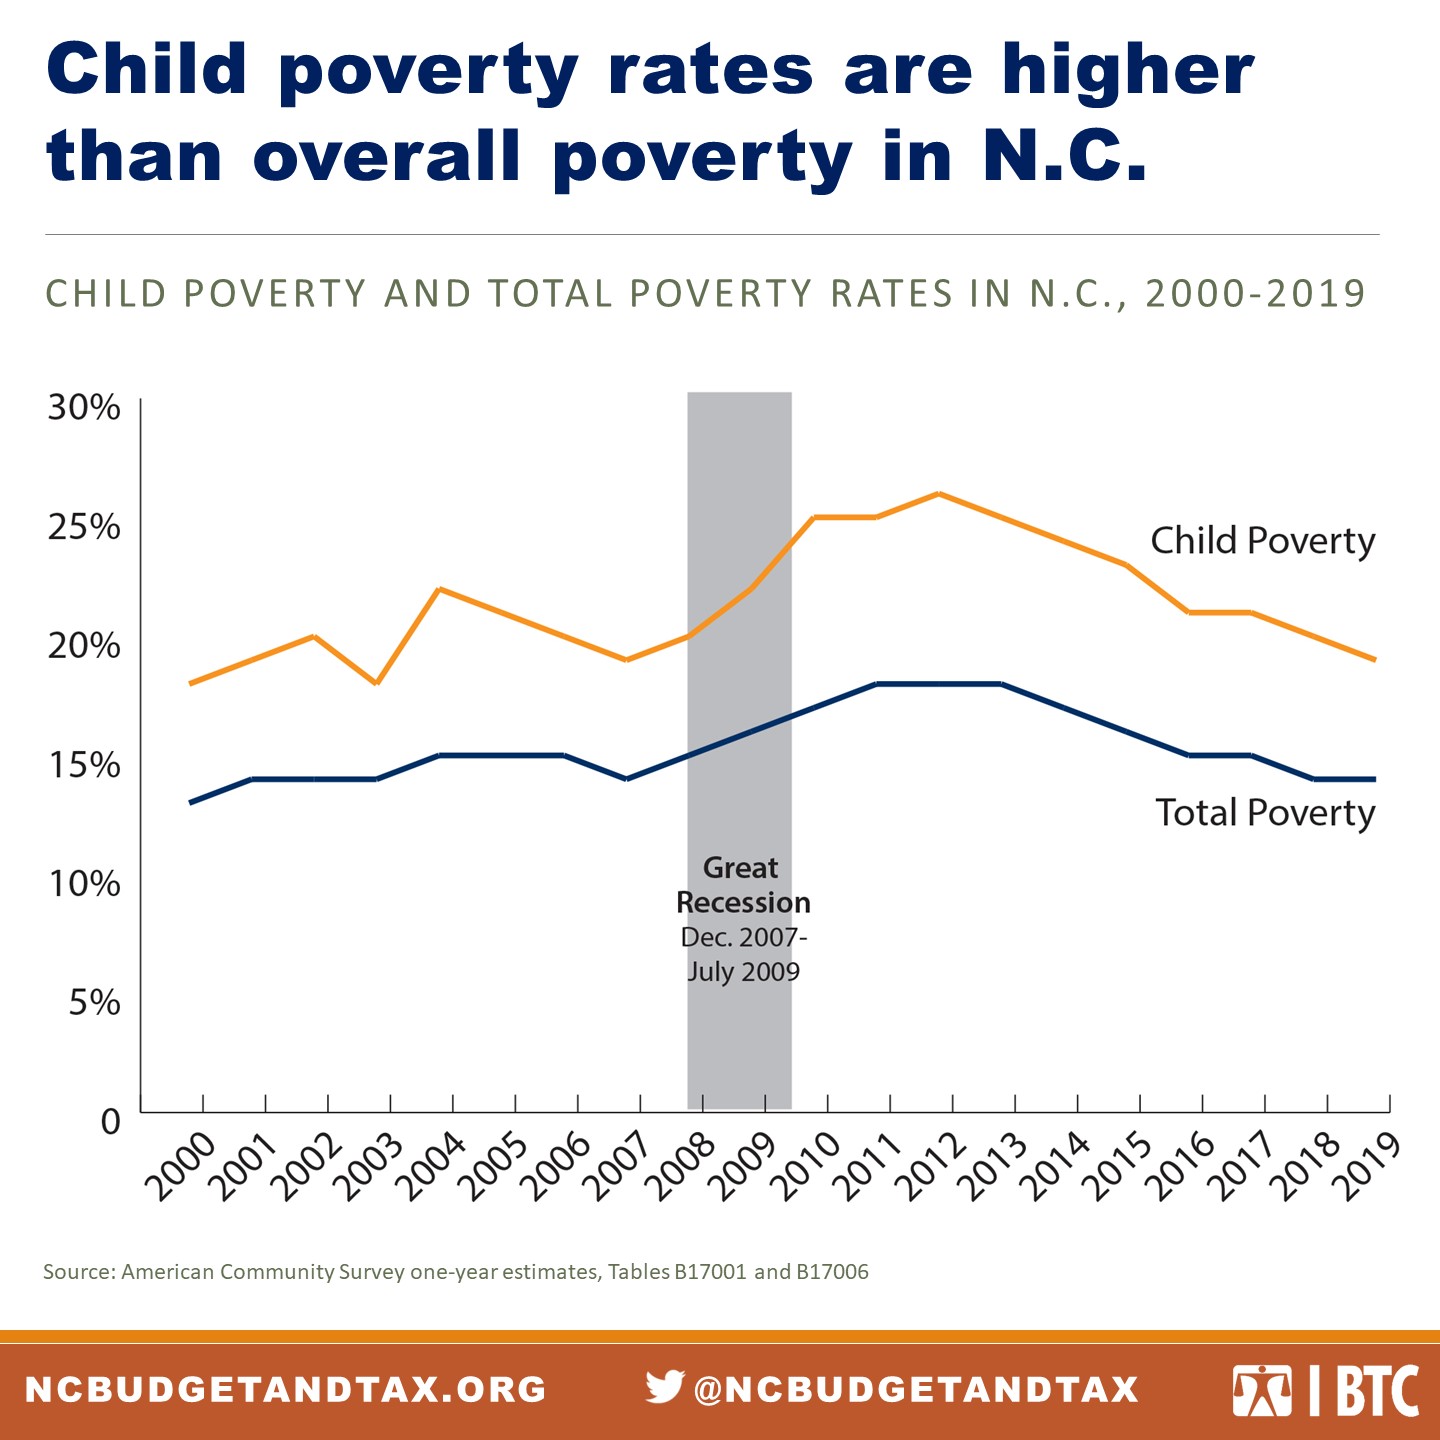
In 2019, 1 in 5 North Carolinians under 18, or over 430,000 children, lived in poverty.[19] The poverty rate for children under 5 years old was the highest for any age group at 22 percent.[20] As shown in Figure 4, child poverty in North Carolina increased more steeply than overall poverty when the Great Recession hit. After peaking at 26 percent in 2012, child poverty has remained elevated in comparison to the total poverty rate as both declined slowly.
The federal poverty guideline is far below the income that North Carolina families need to thrive
The poverty rate is an important data point for understanding hardship in North Carolina, but it is an insufficient measure for whether people in the state can meet their basic needs, much less save for emergencies or long-term goals. The federal poverty guideline in 2019 was $25,750 for a family of four, meaning that four people living together with a combined annual income under $25,750 would meet the definition for living in poverty.[21] This guideline applies to the entire country, without taking into consideration the major geographic variations in the cost of housing and other goods. Furthermore, the poverty guideline is less than half of a true Living Income Standard, which ensures people can afford all essential goods and services.
The Living Income Standard is based on the actual costs of necessities like food, housing, transportation, health care, and child care.[22] It does not include “non-essential” costs like contributions to savings, entertainment, or recreational travel. For a family of four with two adults and two children in North Carolina in 2019, the average Living Income Standard was $52,946 — more than twice the federal poverty level.[23]
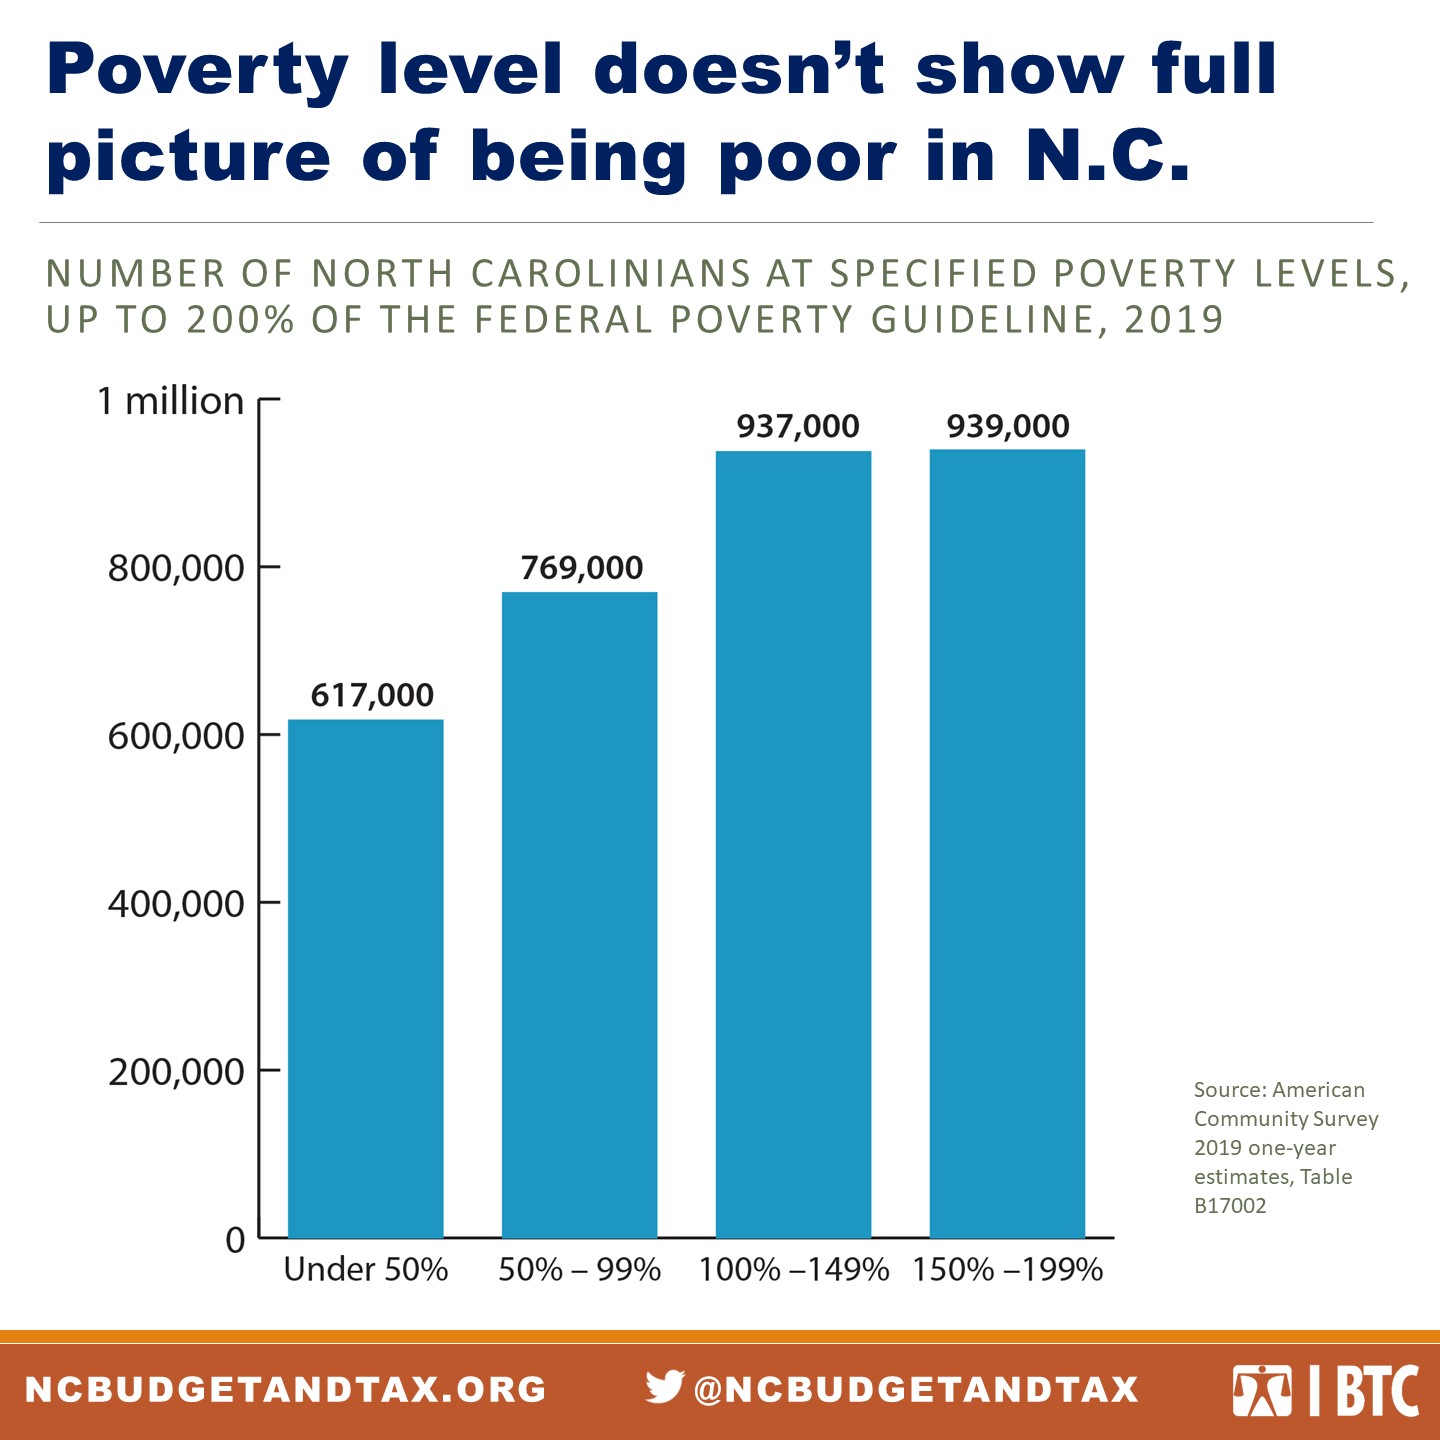
Figure 5 shows that nearly 2 million North Carolinians who did not technically experience poverty in 2019 still had incomes below 200 percent of the poverty level. Altogether, nearly 1 in 3 North Carolinians had incomes below 200 percent of the poverty level, indicating that far more people had difficulty paying for necessities than the official poverty rate indicates.[24] Having a low income, even if it’s enough to cover costs from month-to-month, makes it extremely difficult to build wealth or to save money that can provide a cushion in an emergency. People with low incomes are also less likely to have access to resources that support health like decent housing, high quality educational opportunities, and medical care. This makes income level one of the strongest predictors of health outcomes and life expectancy.[25]
Many people were close to poverty before the COVID-19 pandemic began
The poverty rate also does not show how many North Carolinians were living in financial precarity — one emergency or job loss away from experiencing poverty. Liquid asset poverty measures if households have enough readily accessible savings to weather a three-month period with no income. Having enough liquid assets means that a sudden job loss or unexpected expense doesn’t leave families unable to cover basic needs or cost them their home or business.[26]
Based on the latest available data from 2016, 42 percent of North Carolina households lived in liquid asset poverty, making the widespread job losses caused by the pandemic potentially devastating.[27] While the expansion of government assistance was a temporary lifeline for many families, state and federal policymakers have failed to act to extend income supports as the economic crisis continues.
The racial inequities on display in poverty rates show up when examining liquid asset poverty. In North Carolina in 2016, the liquid asset poverty rate was 33 percent for white households and 63 percent for Black households.[28] This disparity is caused by income inequities along with a long history of policy choices and ongoing racial discrimination that have created barriers to wealth-building for Black families. These include housing policies like redlining and racially restrictive covenants that have prevented many Black people from purchasing homes, one of the key mechanisms for intergenerational wealth transfer in the United States.[29] The Great Recession further entrenched inequities in wealth: Black and Latinx homeowners were more likely to be targeted for the subprime loans that led to the foreclosure crisis.[30]
Safety net programs lift millions of North Carolinians out of poverty
Deep poverty is defined as having an income at or below 50 percent of the federal poverty level — in 2019 this would be an income of less than $13,000 for a family of four. Figure 5 shows that 617,000 North Carolinians, or 6 percent of the total population, lived in deep poverty in 2019.
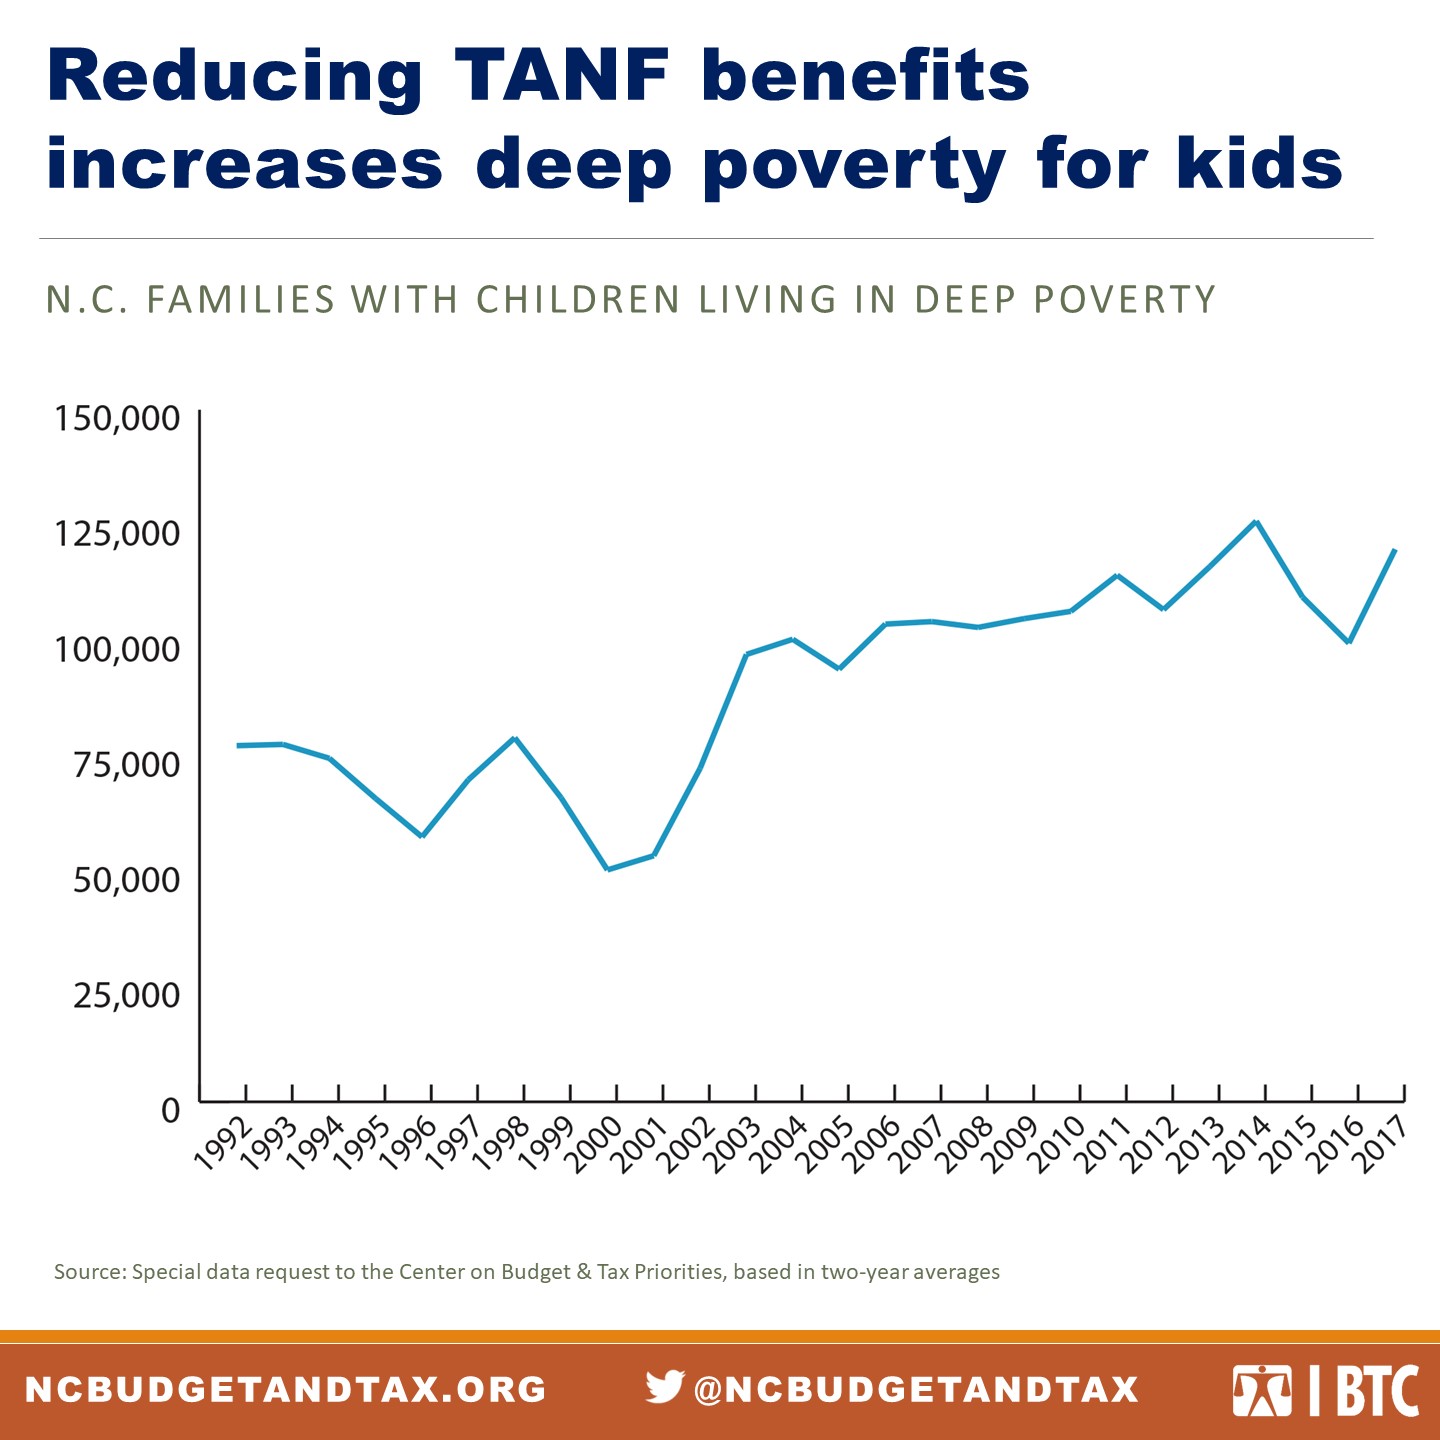
In Figure 6, an analysis of historical data on deep poverty for families with children shows that the number of these families increased after the 1996 federal welfare reforms, which significantly reduced cash benefits provided to female-led households through the Temporary Assistance to Needy Families (TANF) program.[31]
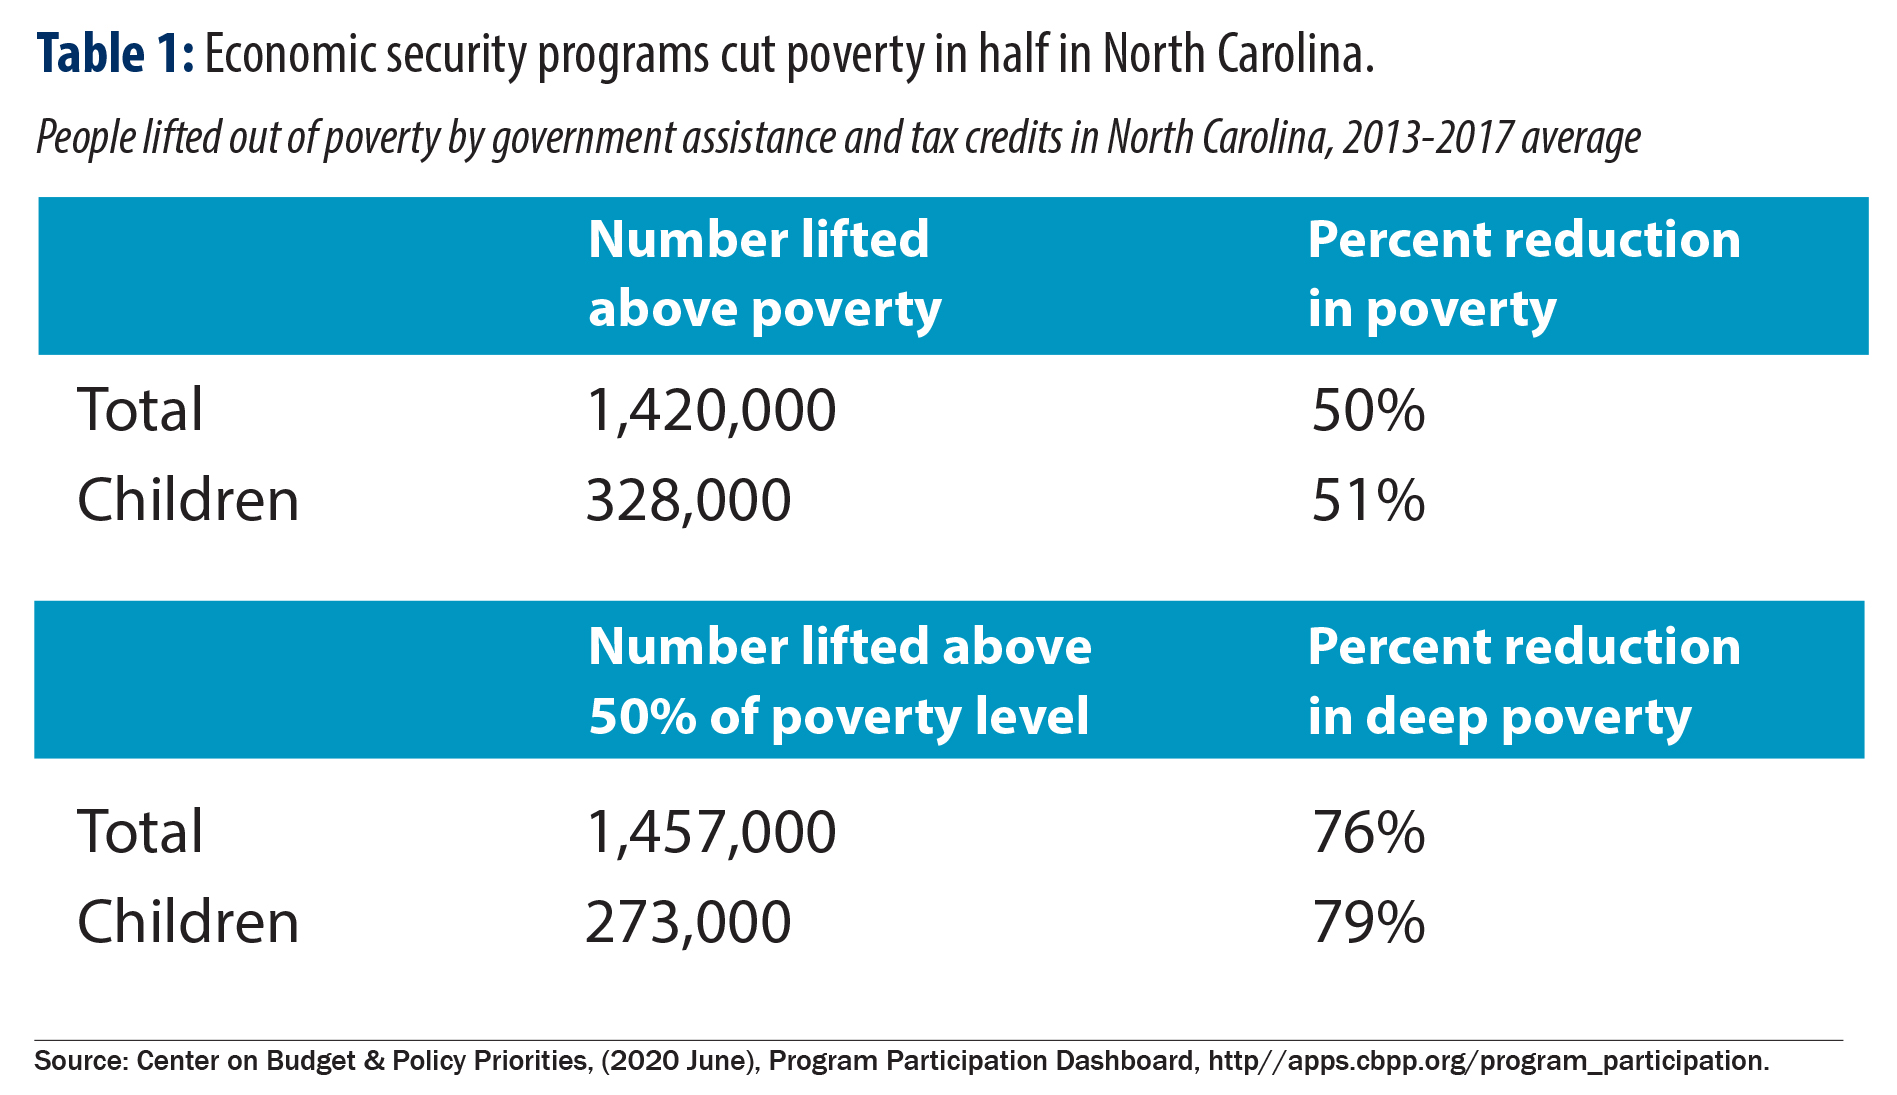
The Supplemental Poverty Measure (SPM) from the U.S. Census Bureau is another tool for addressing some of the shortcomings of the federal poverty guidelines. The SPM incorporates a variety of adjustments to the poverty measure, including the addition of non-cash benefits such as the Supplemental Nutrition Assistance Program (SNAP), housing assistance, and tax credits for working families like the Earned Income and Child Tax Credits.[32] Data from the SPM allows researchers to see how effective these programs are at lifting people out of poverty. Table 1 shows the results of this analysis for North Carolina, which reveals that direct government assistance and tax credits together halve the number of people experiencing poverty in North Carolina. These effects are even stronger for lifting people out of deep poverty.
This research makes clear that safety net programs are effective at reducing poverty — expanding these programs is one of the key elements of an anti-poverty policy agenda.
Hardship is widespread during the COVID-19 pandemic
Poverty can seem like an abstract concept, but fundamentally this issue is about whether people can meet basic needs for themselves and their families — things like putting healthy food on the table, having a safe and stable home, and getting medical care. When people face material hardship and can’t afford these necessities, it leads not only to suffering in the immediate term, but it can have long-term effects on health and economic mobility. Economic insecurity is not an uncommon experience — almost 60 percent of Americans will experience poverty at some point in their adult life, and more than 3 in 4 will spend at least one year below 150 percent of the poverty level.[33] But mass unemployment caused by the COVID-19 pandemic, combined with a total lack of sustained government response, has pushed levels of hardship to new extremes.
Everyone who has lived through a period of economic insecurity knows how challenging it is to plan for the future when immediate needs aren’t met. Sustained hardship contributes to chronic stress, which in turn can cause or worsen chronic physical and mental health conditions.[34] This is especially hard on families and can disrupt children’s cognitive development and educational outcomes.[35]
New data from the Household Pulse survey shows many North Carolinians cannot meet their basic needs
This year, the American Community Survey data are an especially inadequate measure of poverty in our state. While this data always lags by a year, the economy has changed drastically in a very short period of time since COVID-19 hit, leading to mass unemployment and income losses and making statistics from 2019 far less relevant for understanding current poverty and income levels. The Household Pulse Survey is a new experimental survey conducted by the Census Bureau to measure the effect of the pandemic on people’s lives.[36] It shows that high levels of hardship — like the inability to pay for food or rent — are widespread.
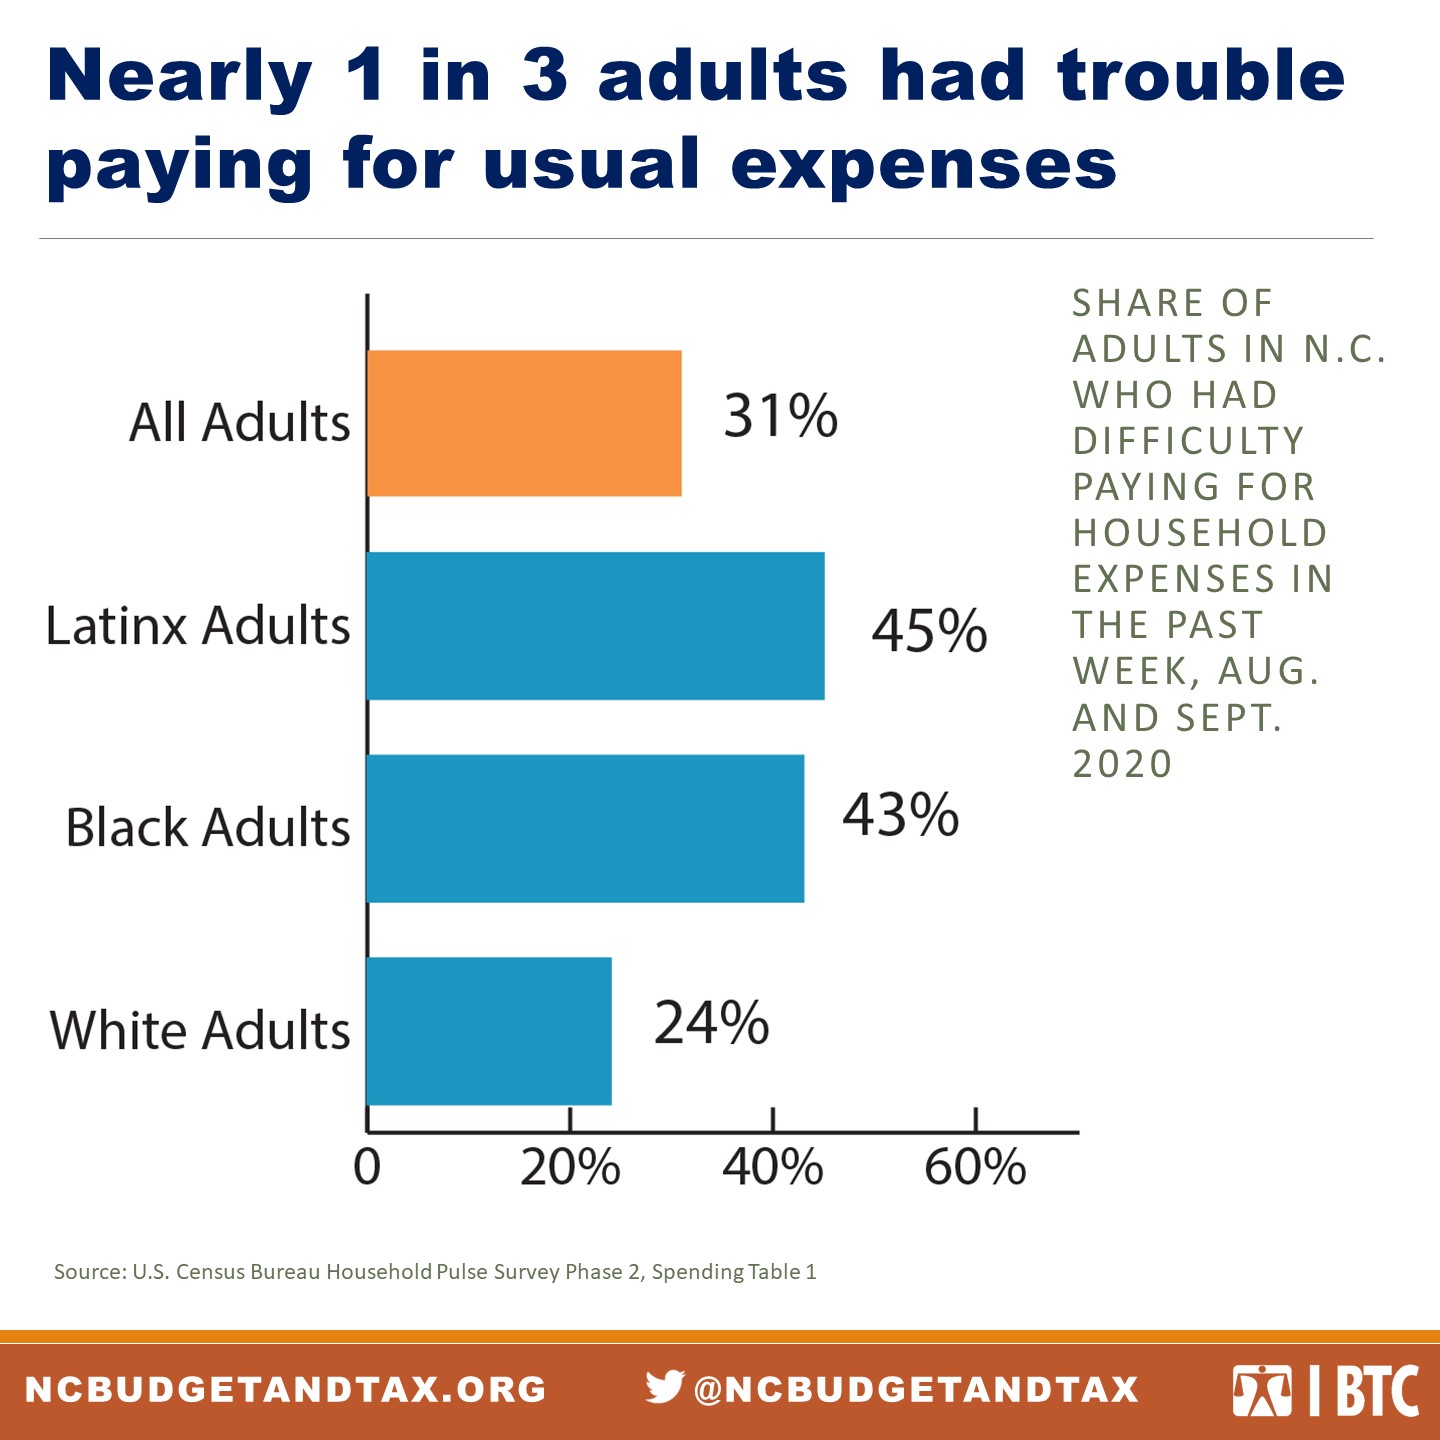
As shown in Figure 6, a third of adults in North Carolina are having trouble covering normal household costs. The stark racial inequities prevalent in state poverty data are evident in the Household Pulse Survey as well, with Latinx and Black people showing much higher rates of difficulty than white people. (While the survey includes data on Native American and Asian people as well, these results are unreliable due to very small sample sizes and so are not included here.) The consistently high rates of hardship for Latinx people shown in this survey may reflect the fact that noncitizen immigrants, as well as U.S. citizens who filed taxes with noncitizen family members, were excluded from key relief measures like the economic impact payments in the federal CARES Act.[37] Congress excluded noncitizen immigrants from these supports despite the fact that many of the essential jobs where workers were most likely to be exposed to COVID-19 — such as meatpacking — are dominated by immigrant workers.[38]
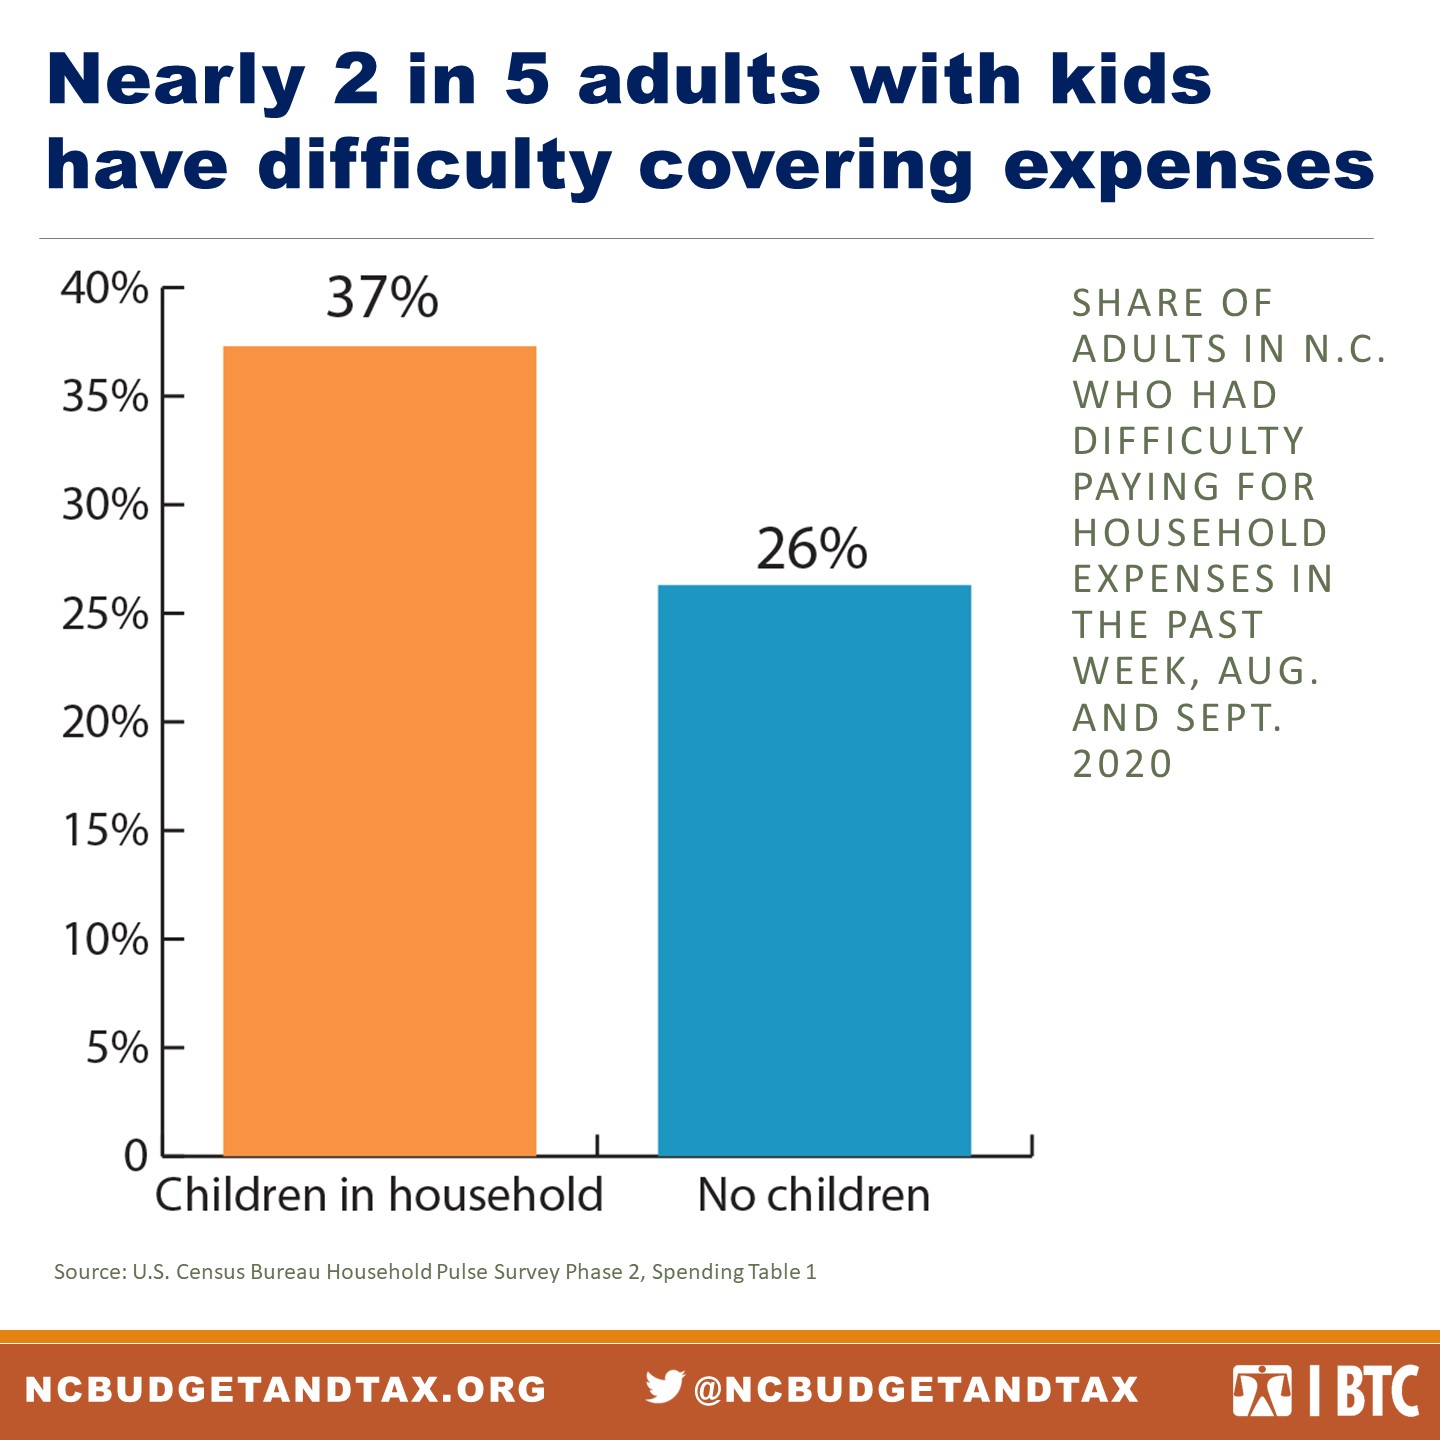
As shown in Figure 8, adults with children in their households are more likely to report difficulty covering expenses. This is hardly surprising given the high rates of child poverty leading into the pandemic and the specific stresses that the pandemic has placed on parents trying to juggle work and child care. This trend of disproportionate hardship faced by households with children is consistent across the measures included in the Household Pulse Survey.
North Carolina renters don’t know how they’ll catch up on rent
Even before COVID-19, many people in North Carolina put huge portions of their income toward paying for housing. Housing costs have continued to rise as incomes have stayed stagnant, and people with the lowest incomes often have to devote the majority of their annual income to keeping a roof over their head. More than 70 percent of North Carolinians with extremely low incomes (roughly equivalent to the poverty level) spend half or more of their earnings on housings costs.[39]
Households that spend over 30 percent of their income on rent and utilities are considered rent burdened, while those that pay over half of their income are considered extremely rent burdened. Nearly half of all renter households in North Carolina in 2019 were rent burdened.
- 598,000 renter households, or 46 percent, were rent burdened, spending over 30 percent of their income on rent.[40]
- 280,000 renter households, over 1 in 5, were severely rent burdened, paying half or more of their income on rent.[41]
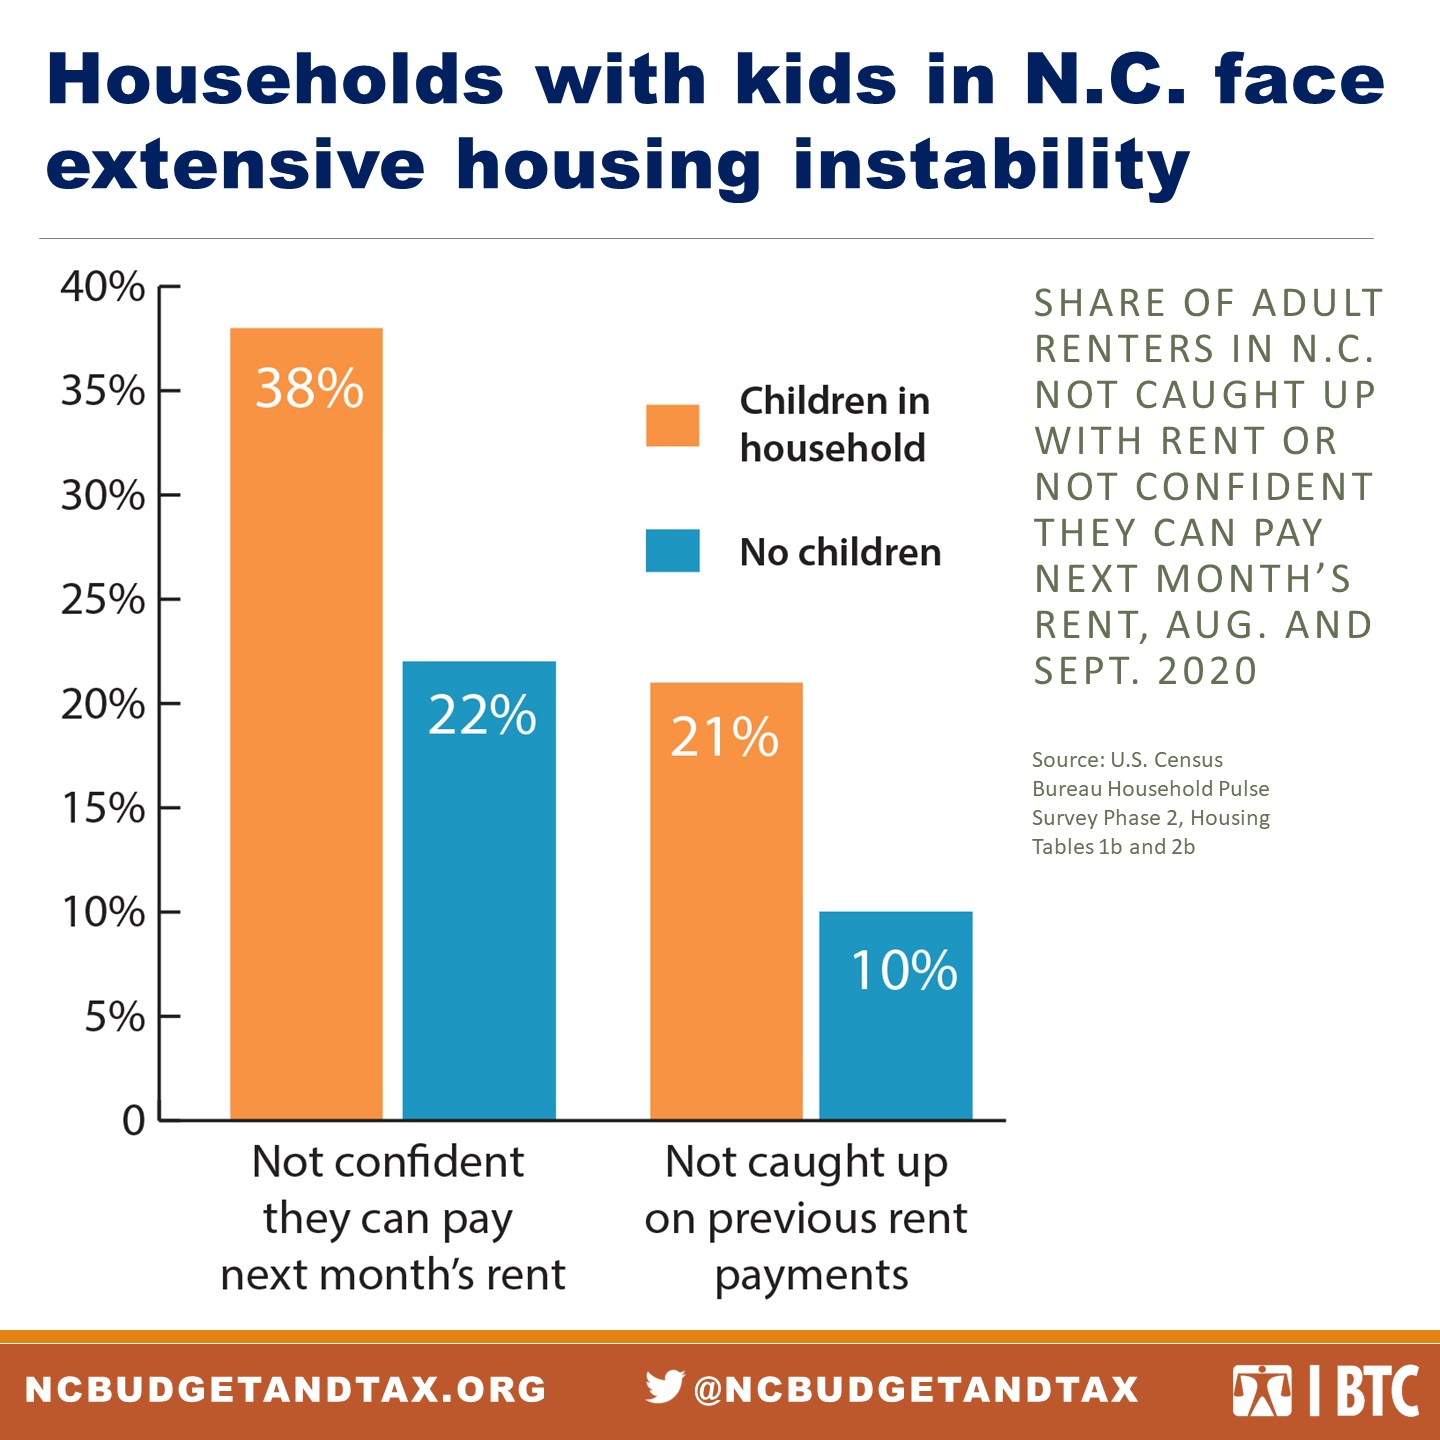
Faced with widespread job loss, hundreds of thousands of North Carolinians have now missed rent payments or aren’t confident they’ll be able to pay their next month’s rent. Figure 9 shows that among adult renters with children, 1 in 5 aren’t caught up with past rent payments, while 2 in 5 aren’t confident they’ll be able to pay next month’s rent.
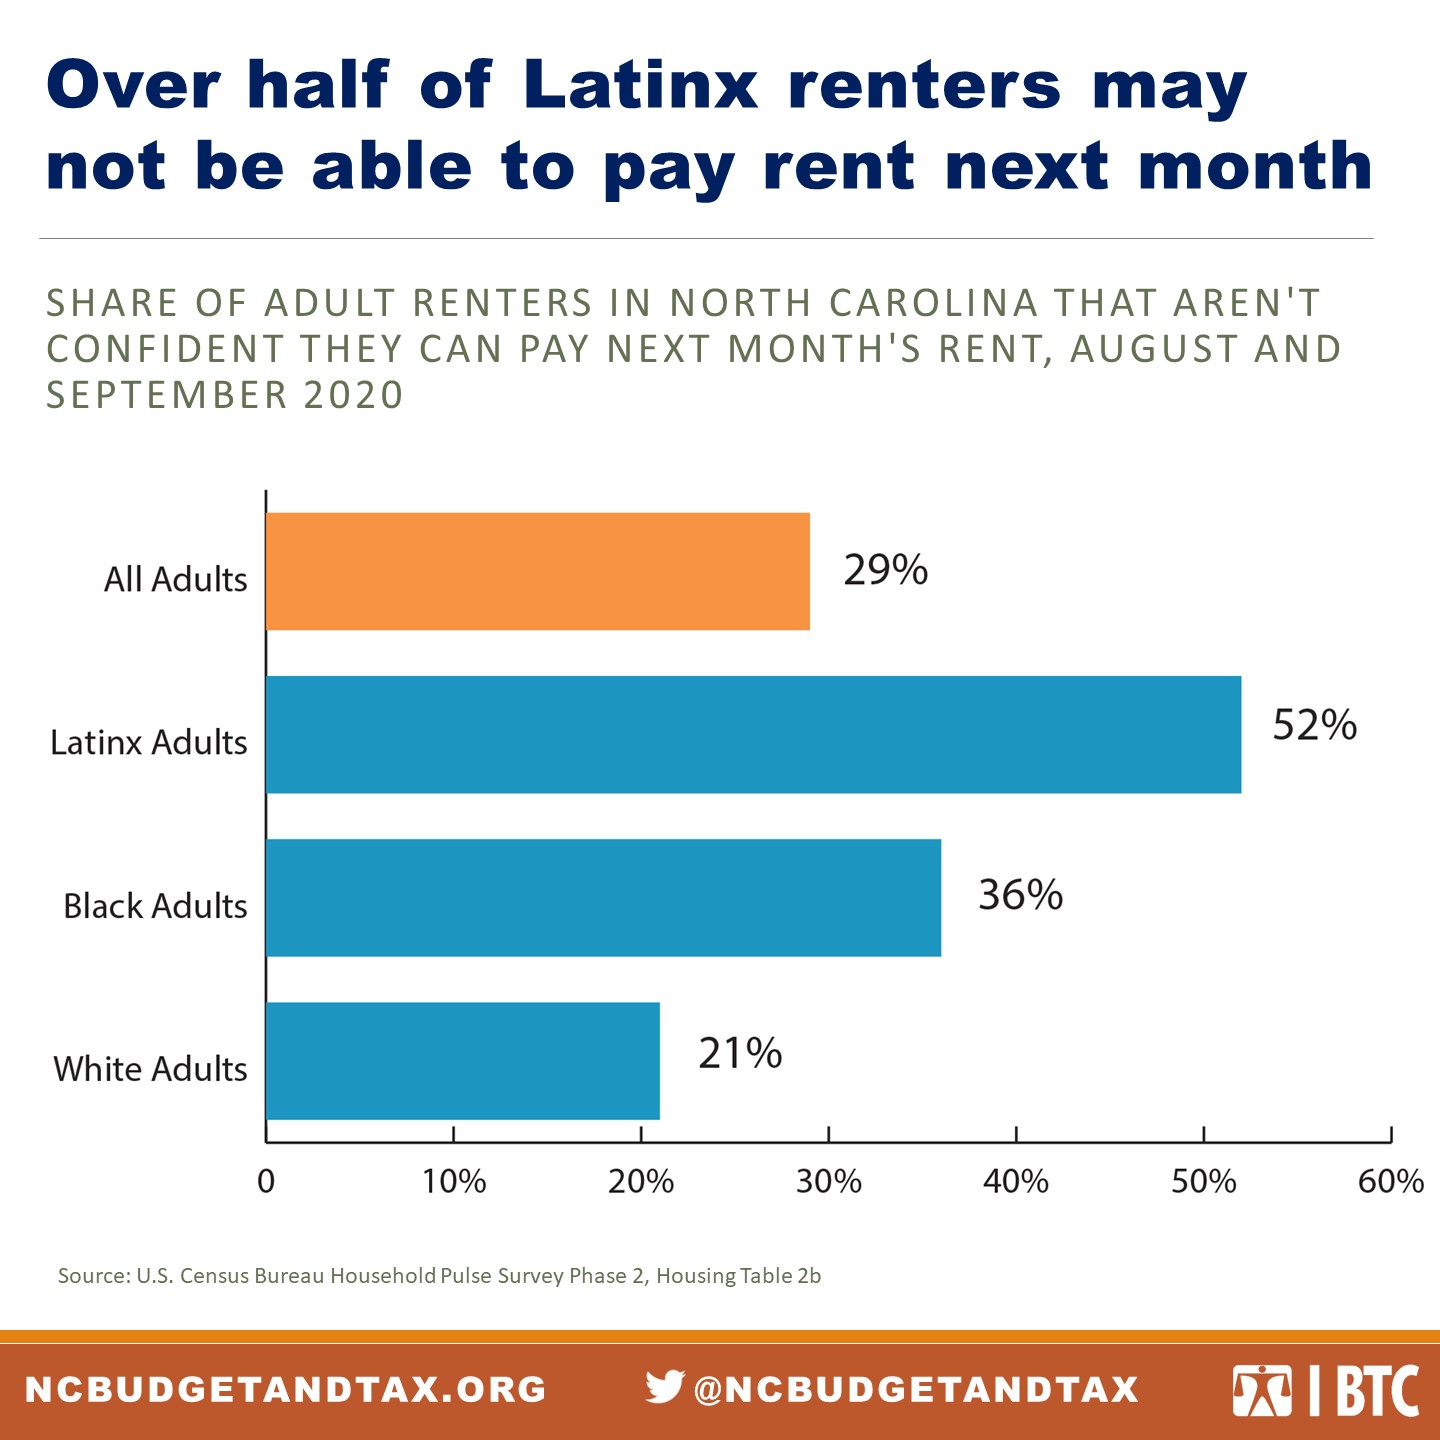
Twenty-nine percent of all adults in North Carolina aren’t sure they’ll be able to pay next month’s rent. As shown in Figure 10, racial inequities persist for housing hardship, with over half of Latinx and 1 in 3 Black renters facing uncertainty about their next month’s rent payment.
People who are behind on their rent payments are living with major uncertainty about losing their housing. About 3 in 5 North Carolina renters whose households are not caught up on rent payments think they are likely to be evicted in the next two months.[42]
While the Centers for Disease Control have issued a federal moratorium on residential evictions for failure to pay rent through the end of 2020, the moratorium does not apply to all renters, and the eligibility rules are complex.[43] While this moratorium is better than having no protections in place, it places the burden of proving eligibility on tenants, who are facing high levels of stress and instability and will likely need legal assistance if their landlord contests eligibility.[44]
Increased levels of food insecurity are clear from survey data and SNAP enrollment
Food security is a critical measure of well-being, and not having enough nutritious food has a wide variety of negative consequences for health. These consequences range from chronic disease like hypertension and diabetes to depression and anxiety to behavioral problems among children.[45] One measure of food insecurity is the increase in people seeking food assistance: The number of North Carolinians participating in SNAP benefits increased by 22 percent from February through September 2020.[46]
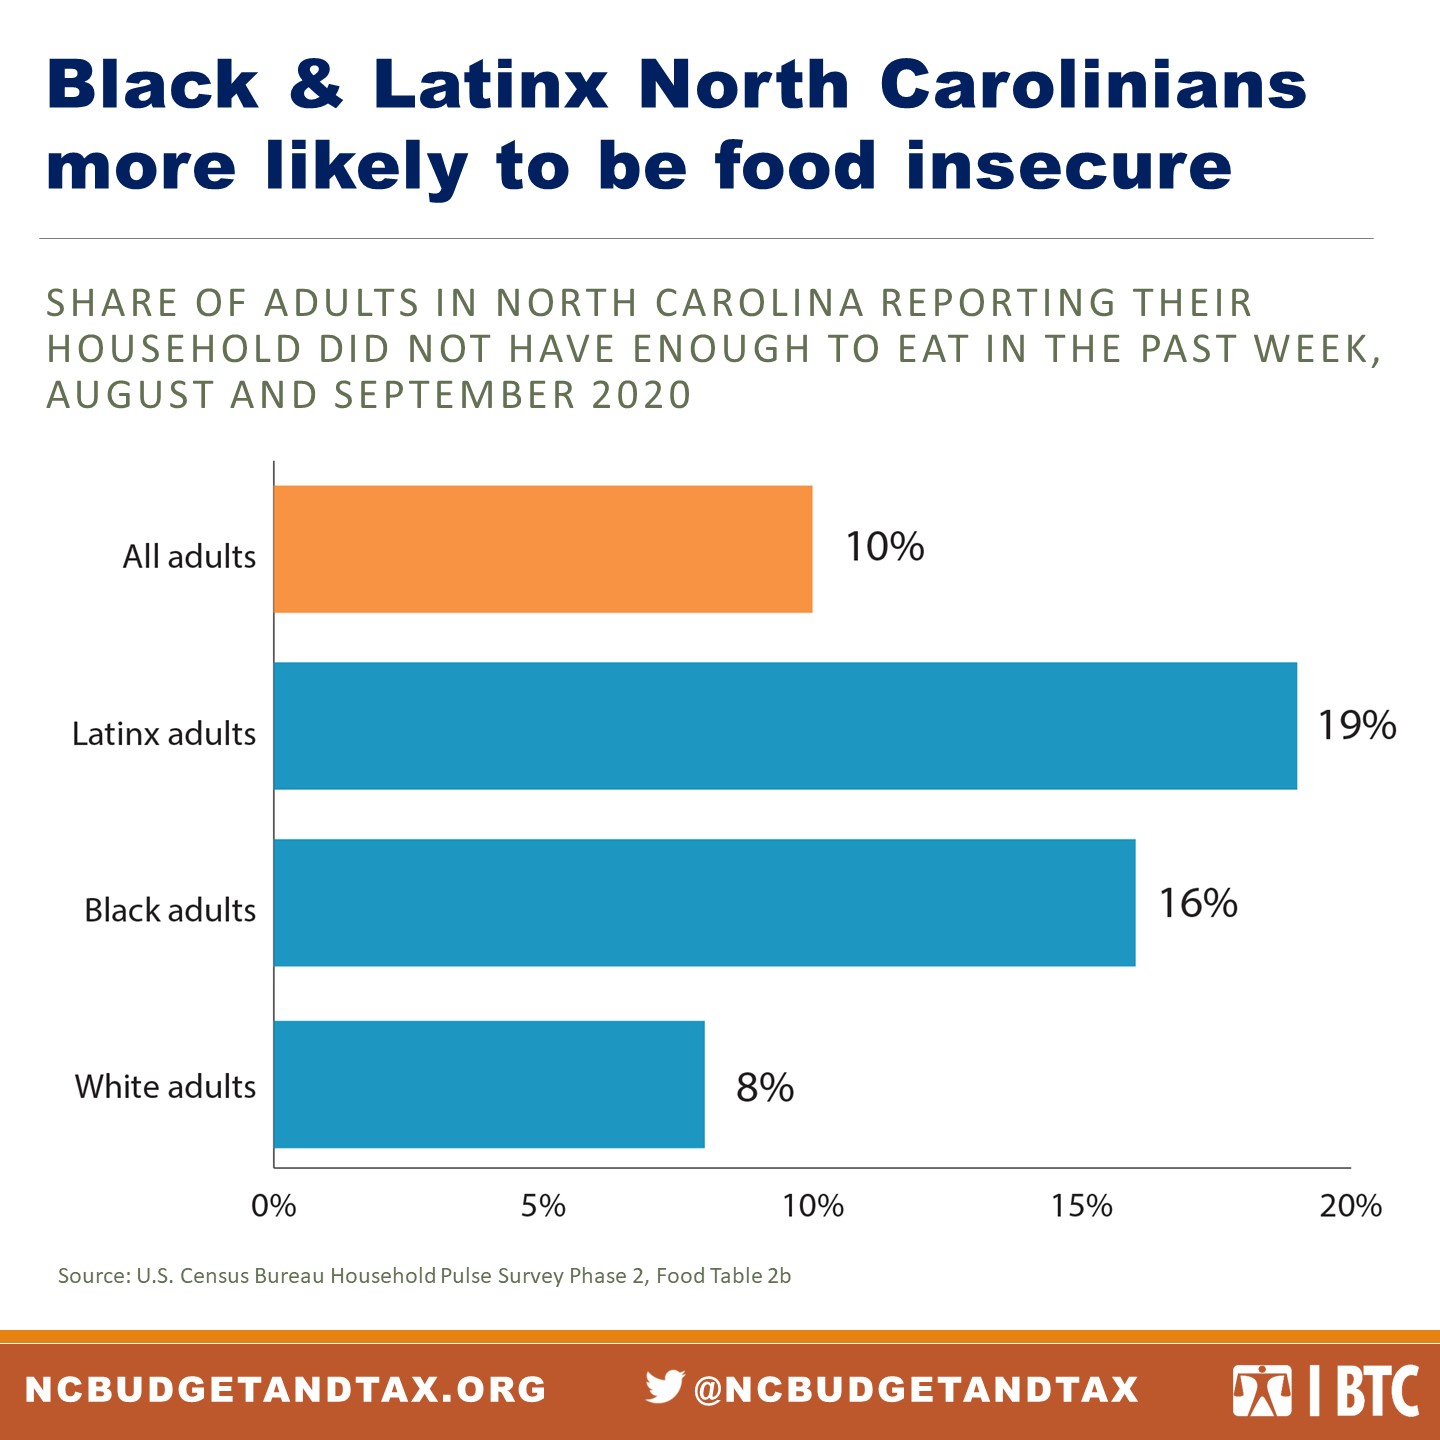
Household Pulse data also show that 1 in 10 adults in North Carolina reported not having enough to eat in the past week, and Figure 11 again shows a pattern of Latinx and Black people experiencing disproportionate harm.
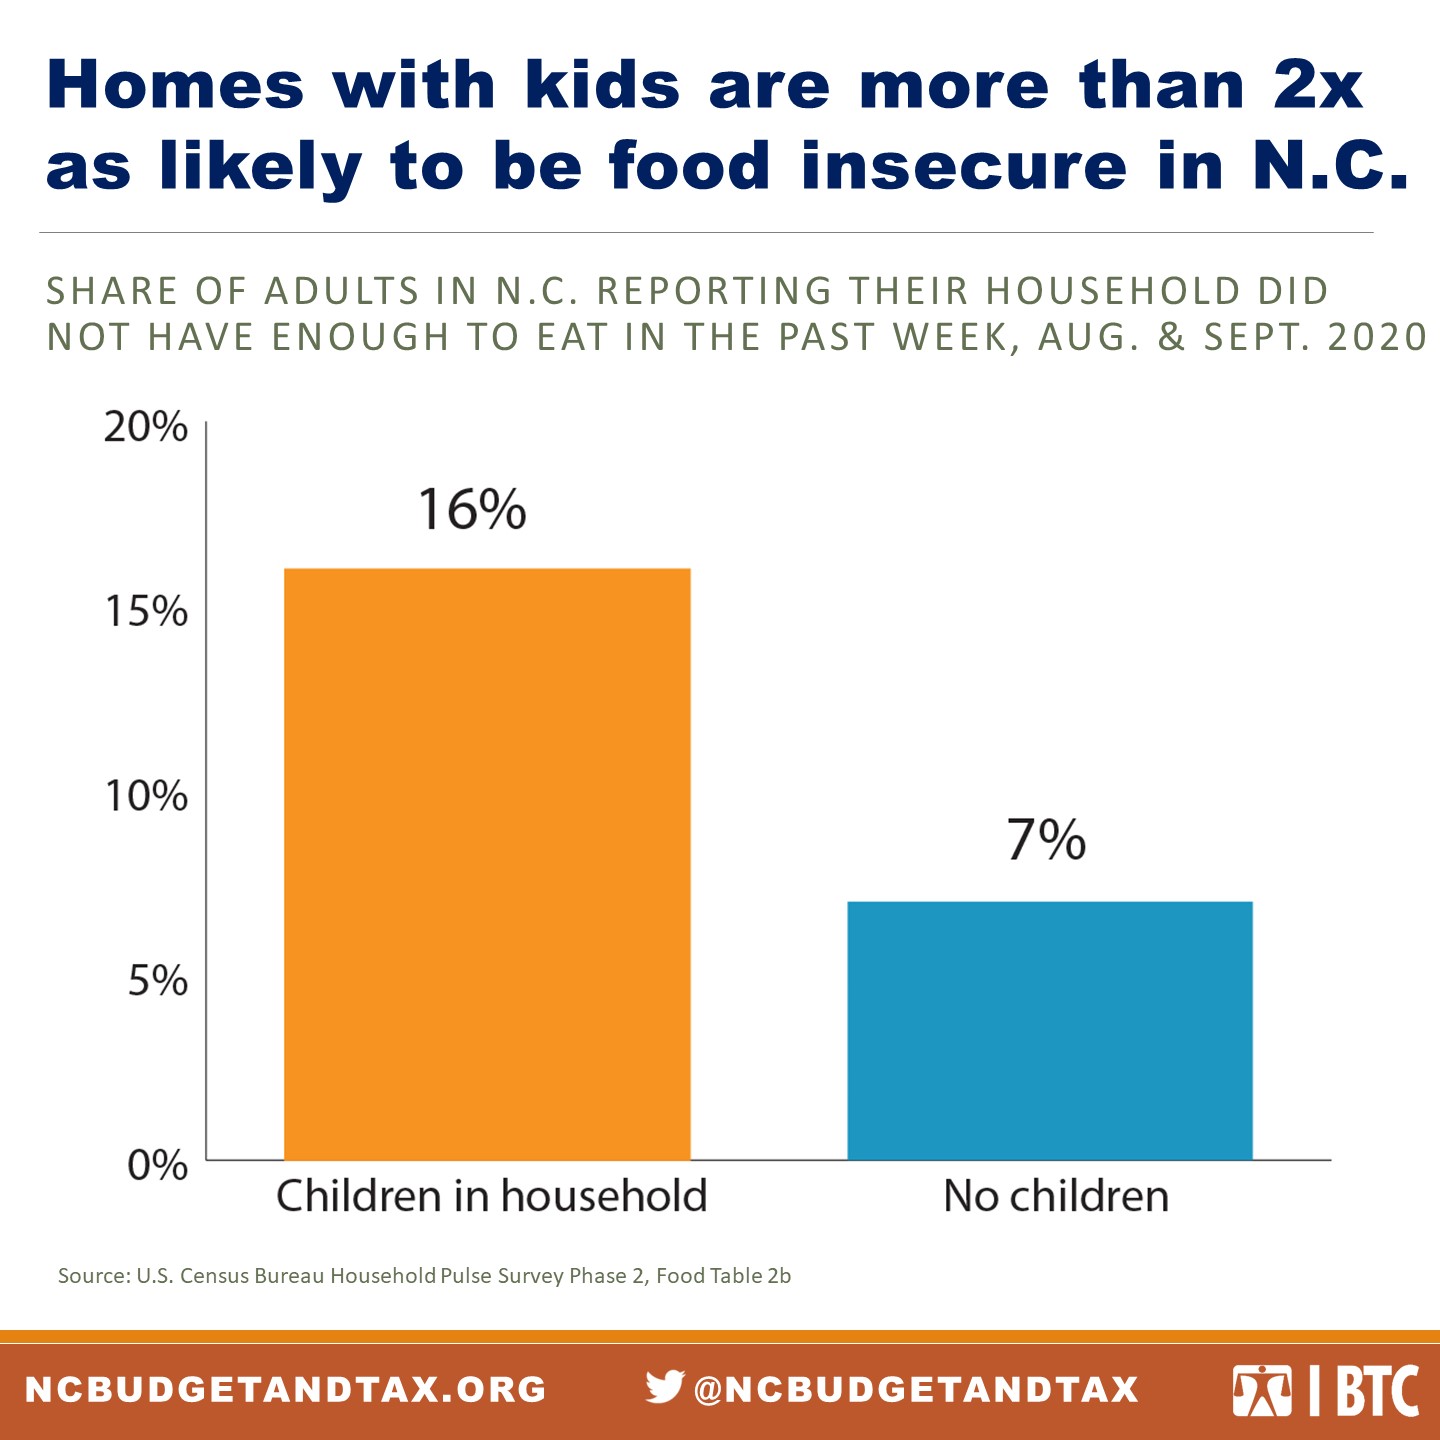
When it comes to food insecurity, households with children are again reporting higher rates of hardship. Figure 12 shows that 1 in 6 adults with children in their household reported not having enough to eat in the past seven days.
Low-wage workers are left behind as jobs return for higher wage workers
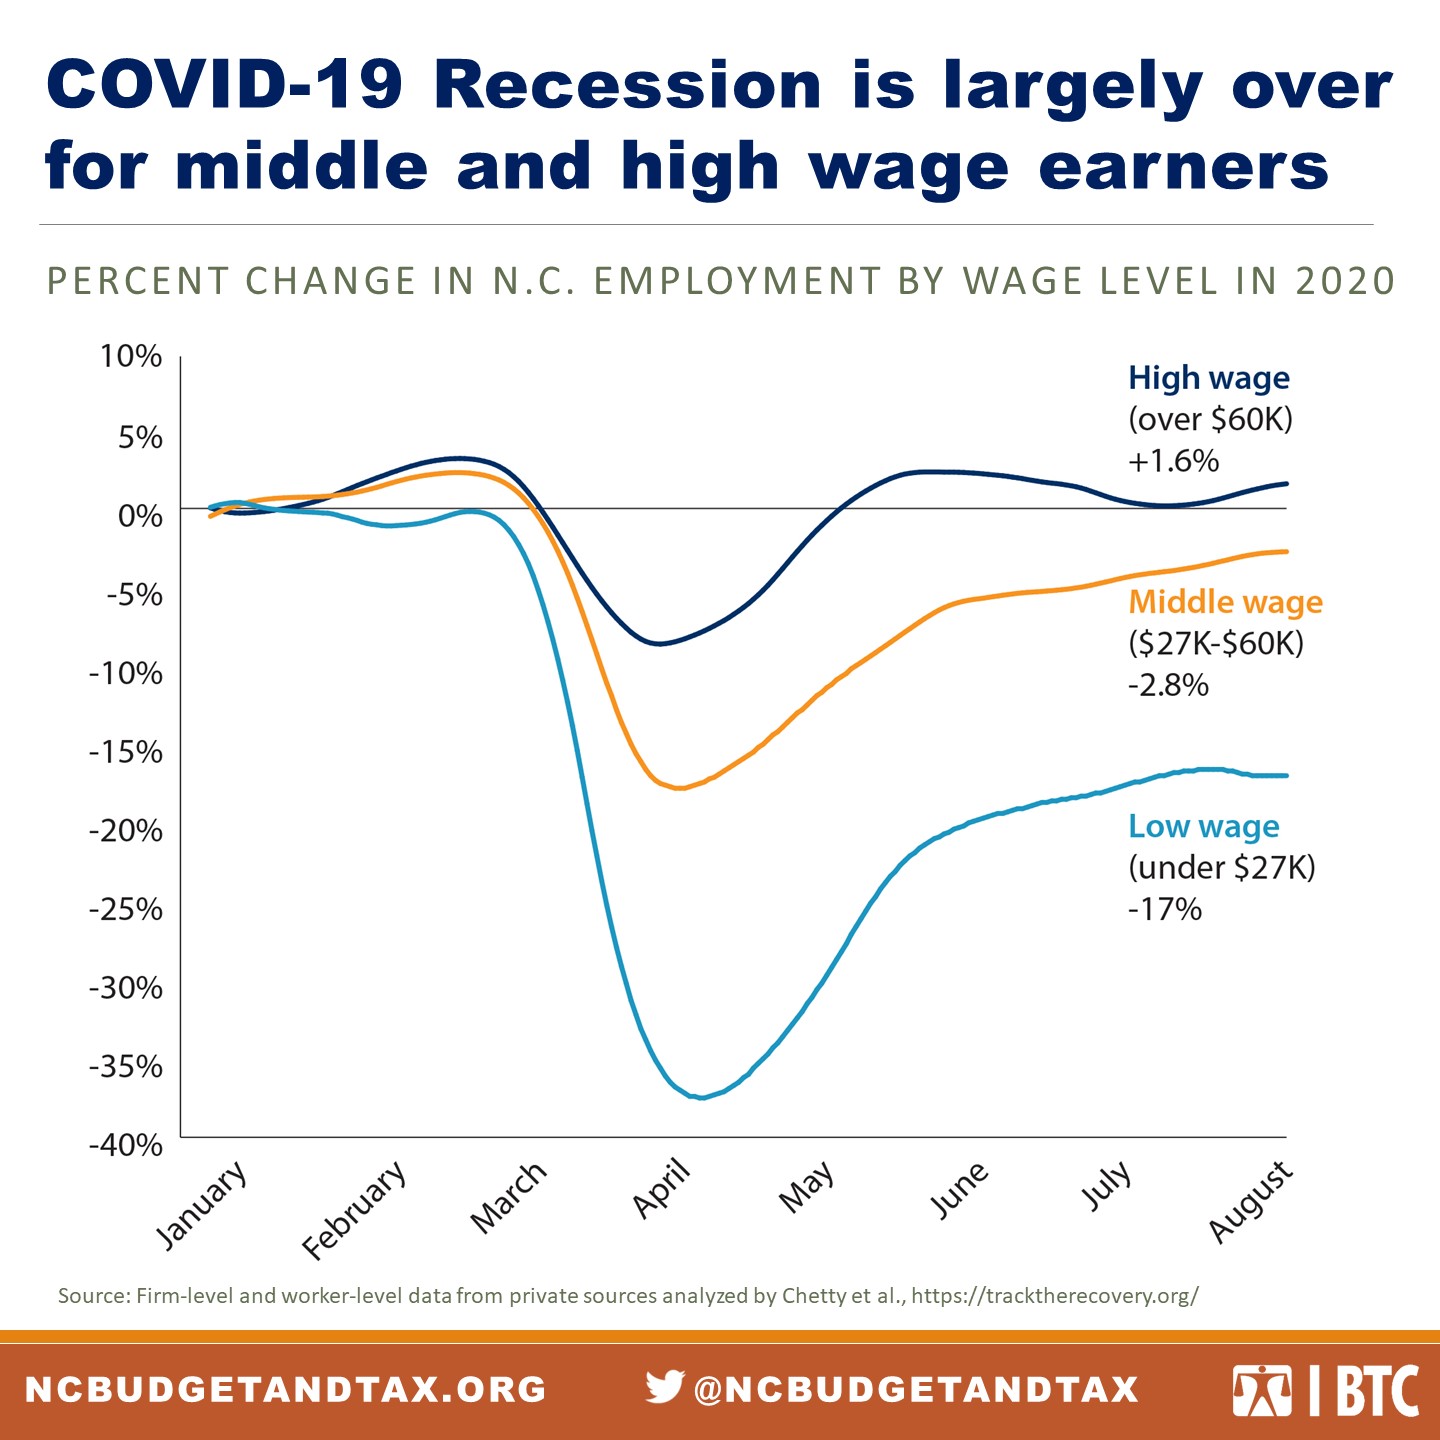
Employment data by wage from August 2020 show that the recession caused by COVID-19 has largely ended for high and middle wage earners in North Carolina. Figure 13 shows that there are still far fewer low wage jobs — paying below $27,000 per year — than there were in January 2020. In contrast, there are slightly more high wage jobs than before the pandemic.
Data like this, along with a stock market recovery that has little effect on working class Americans, have led economists to declare that “the recession is over for the rich.”[47] Without decisive action to address hardship for the people who are still struggling, economists are predicting a “K-shaped recovery” in which outcomes continue to diverge sharply for wealthy and low-income people.[48]
COVID-19 relief was crucial but didn’t go nearly far enough
COVID-19 relief measures, like the additional unemployment benefits and economic impact payments provided by the federal CARES Act, offered a lifeline for many families. But these supports were unavailable for too many people, including many immigrants who were categorically excluded from provisions of the CARES Act.[49] Economic impact payments were distributed primarily by the IRS, and people with incomes too low to file tax returns, without bank accounts, or without internet access were less likely to receive payments on time, if at all.[50] One survey of SNAP recipients in North Carolina found that half of respondents had problems applying for aid during the pandemic and that unemployment benefits and the economic impact payments were the hardest to attain.[51] The key income supports in the CARES Act have now expired, and neither the federal nor state governments have shown any indication that it will act to meet the dire need for additional relief.
Nationwide estimates have found that although the CARES Act offset monthly poverty increases in April and May 2020, the monthly poverty rate increased from 15 percent in February to 16.7 percent in September after the additional $600 weekly unemployment payments ended.[52] Consistent with the Household Pulse Survey and the lived experience of communities across the U.S., increases in monthly poverty rates have been the steepest for Black and Latinx households and for households with children.
Building an equitable economy is necessary for a true recovery from COVID-19
North Carolina cannot afford to rebuild an economy that mirrors the state before COVID-19 when 1 in 7 residents lived in poverty, wealth and income were concentrated in the hands of a few, and racial inequities were the norm. Instead, we can learn from the mistakes made after the Great Recession and work toward a recovery that is targeted toward the people who have been hardest hit by the current economic crisis.
For jobs to address poverty, they must be high quality and pay a living wage
While lack of employment is a major contributor to poverty, many working families in North Carolina were living below the poverty level in 2019. North Carolina’s minimum wage is equal to the federal minimum wage at $7.25 per hour, and a full-time minimum-wage job pays just $15,080 annually, far lower than the Living Income Standard. A single parent working a minimum wage job and caring for two children would need to work more than 56 hours per week in order to lift their family above the poverty line.
In 2019, for 1 in 4 families living in poverty in North Carolina, the head of household or their spouse was working full time.[53] Job quality is not just a matter of wages: For a job to provide opportunities for saving and economic mobility, it also needs to offer sufficient and steady hours. Many of the jobs that were added during the economic expansion offered neither, and variable hours and involuntary part-time work have become a significant contributor to low incomes across the country.[54]
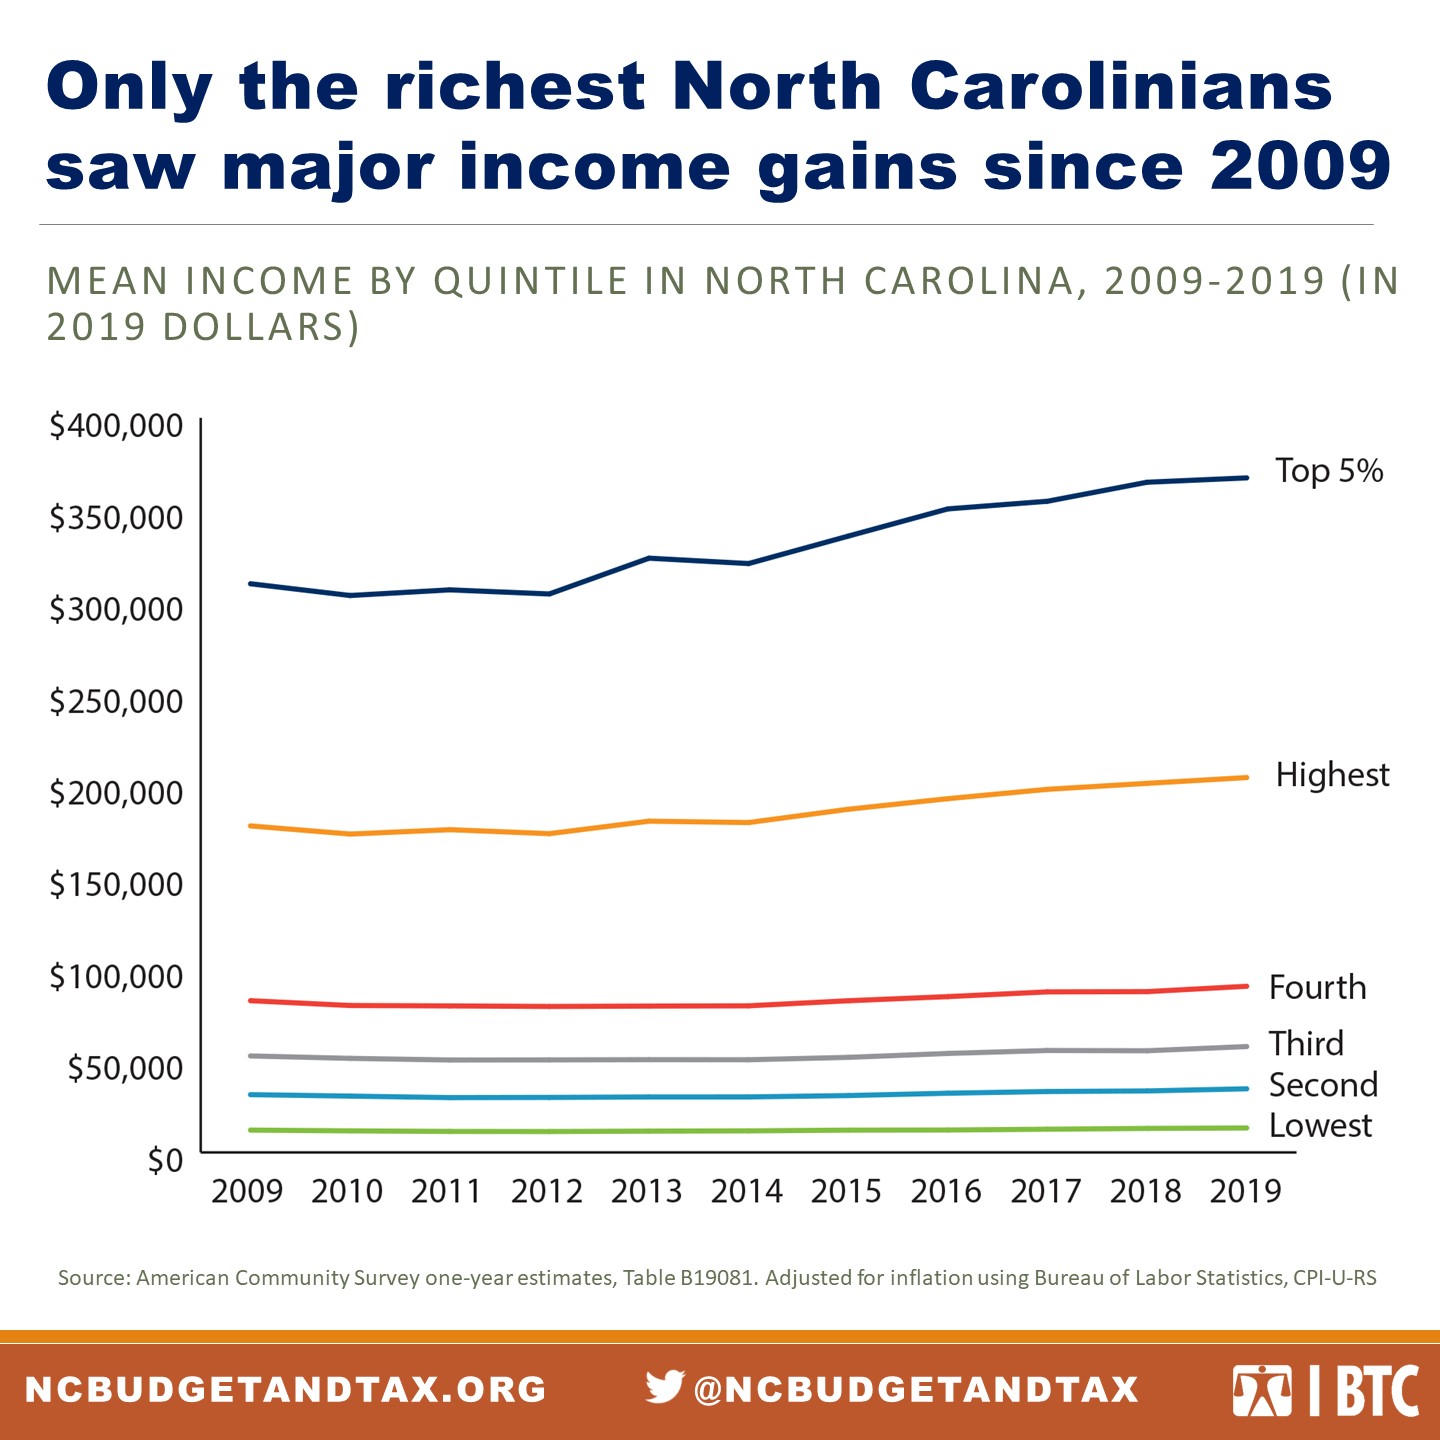
Figure 14 shows that since the Great Recession, incomes have been largely stagnant for low- and medium-income households in North Carolina, only showing substantial gains for the highest income quintile. The top 5 percent richest households, with an average annual income of almost $370,000, saw by far the greatest increase.
Black, brown, and white North Carolinians are organizing for an economy that works for all of us
North Carolinians who are experiencing the hardships caused by COVID-19 and by policymakers’ inadequate responses are not passive victims of an unjust economy. People are organizing across race and class to meet basic community needs, build support for a sustained public response to poverty, and demand that elected leaders enact policies that lift people out of poverty.
In recent years, the sluggish decrease in hardship rates combined with increasing evidence that poverty effects mobility, inclusion, and growth in ways that harm us all has led several North Carolina communities to embark on collective impact models. In Charlotte, research from the Equality of Opportunity Project drew attention to low economic mobility in the region and prompted the establishment of an Opportunity Task Force focused on aligning services and funding new initiatives to meet community needs.[55] In Fayetteville, the Pathways to Prosperity initiative is engaged in neighborhood-level work to deconcentrate poverty and to advance solutions in housing, education, and health that reduce hardship and its harmful effects.[56]
Nonprofit direct service organizations have recognized the critical role that people experiencing hardship must play in advancing solutions. These organizations are supporting leadership development that connects people to policymakers to inform the design of safety net systems that address widespread needs. One such example is the Circles of Care program run by Crisis Assistance Ministry, which engages people experiencing poverty in the discussion of solutions and service design.[57]
People who are directly affected by poverty and economic exclusion are also organizing to meet community needs, build power, and change policy. The N.C. Second Chance Alliance is using a local chapter model to create a statewide network of people with criminal records who are pushing to remove the barriers to opportunity and financial security for people returning to their community after incarceration.[58] The North Carolina Black Leadership and Organizing Collective is working locally to shift funding away from policing and incarceration and into education and health that support Black people’s well-being.[59] Down Home North Carolina is organizing poor and working-class people in rural counties to build multiracial community leaders and advance economic justice.[60] In the context of COVID-19, people are calling for an inclusive response and for people-first policies that ensure every person — Black, brown, and white — has the resources to survive this public health and economic crisis. Latinx organizations like Poder NC Action have created mutual aid funds to support immigrants who have been excluded from public benefits.[61] The Poor People’s Campaign is demanding a moral response to COVID-19 that addresses the root causes of poverty and inequality.[62]
People and organizations like these are showing all of North Carolina what’s possible.
Conclusion: North Carolina can lead the South in charting a just recovery
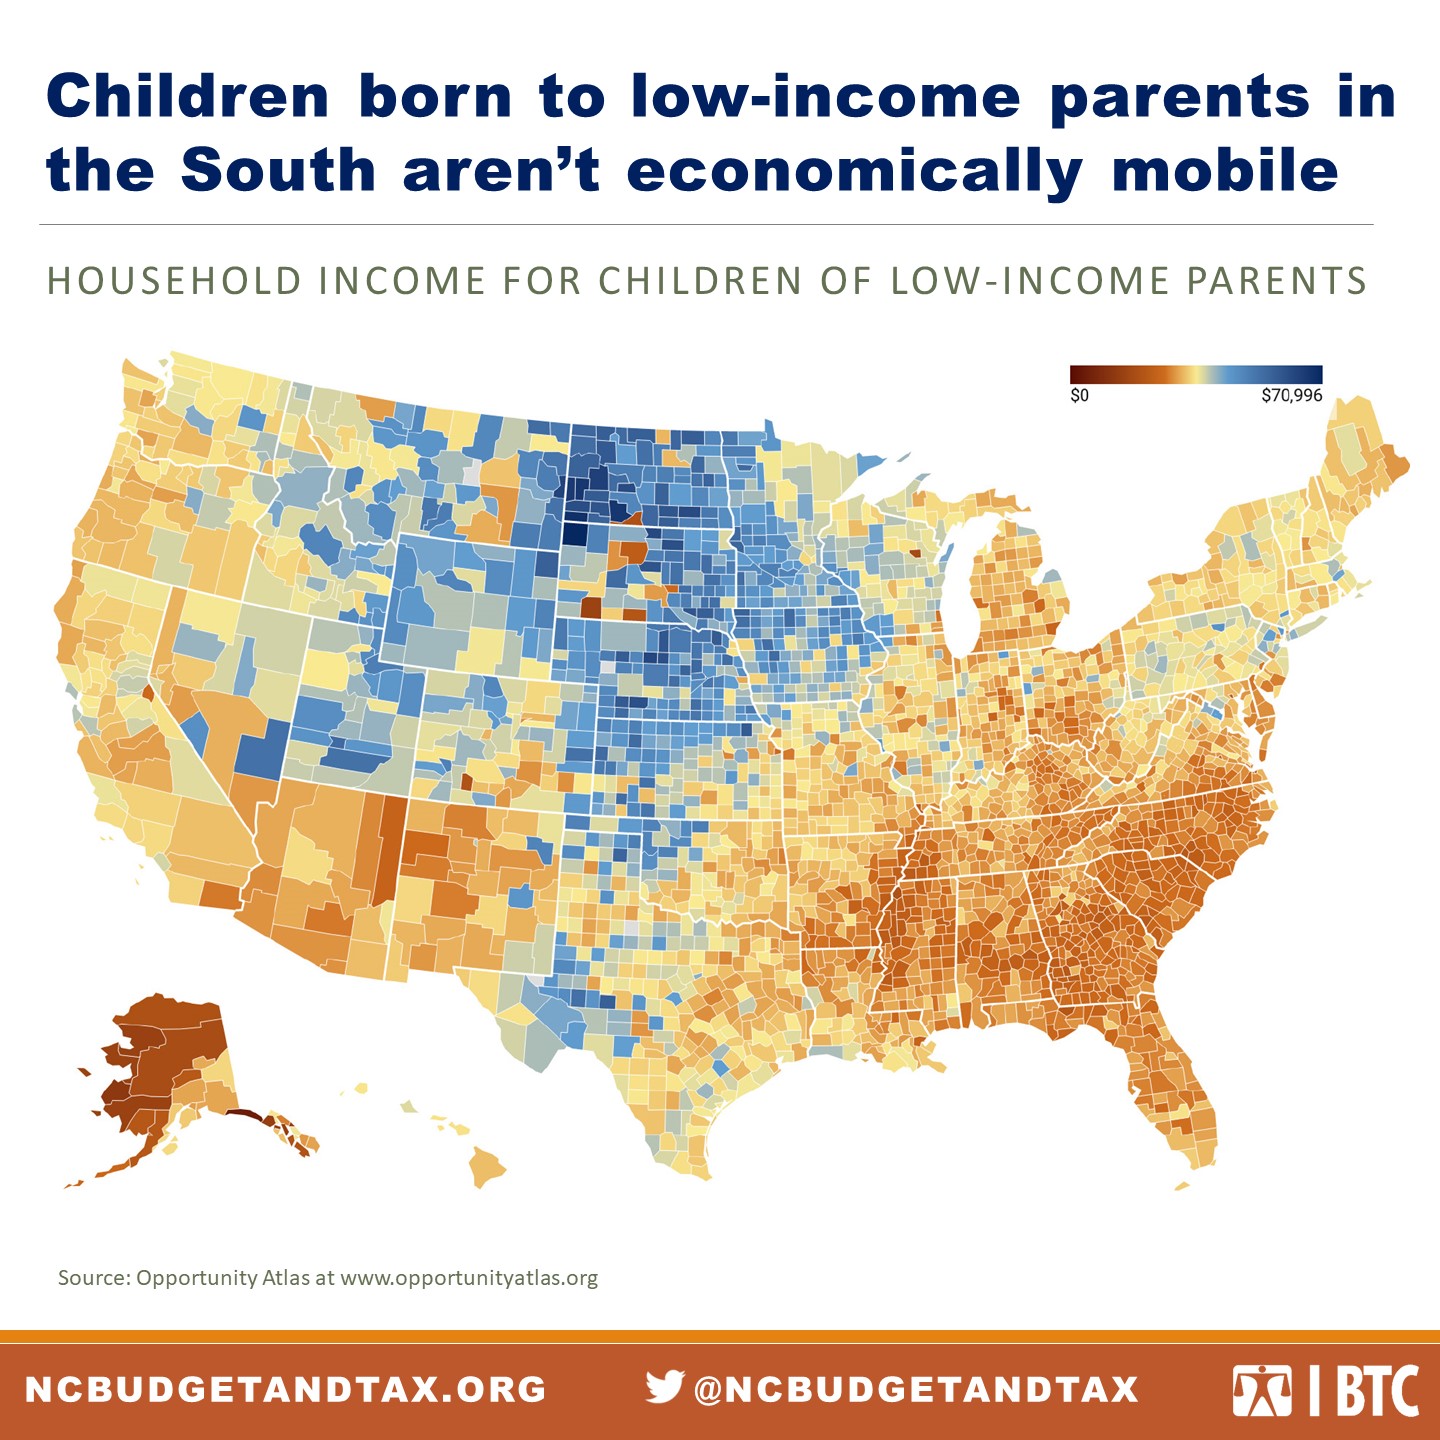
North Carolina’s experience with poverty is emblematic in many ways of the South as a whole. Figure 15 shows a nationwide county-level analysis from the Opportunity Insights project, which explores where children born to low income parents have the greatest chance of economic mobility. North Carolina and the rest of the South stand out as solidly red, a region where children who are born poor face high obstacles to increasing their earnings as adults.
This is not because there is no wealth in North Carolina or because North Carolina parents don’t push their children to succeed. It is because of choices that North Carolina and other Southern states have made — choices rooted in part in the anti-democratic legacy of Jim Crow racism.[63] But North Carolina has the power to make different choices: to raise the minimum wage, to expand Medicaid, and to raise taxes on corporations and those who can afford to pay more in order to fund a robust social safety net. These choices would mean that fewer of the children who are living in poverty right now would go on to live in poverty as adults.
The COVID-19 pandemic has shown a bright light on our state’s inequitable economy and on the financial precarity of so many North Carolinians, especially Black, Latinx, and Native American residents. Now, North Carolina has the chance to use this light to chart a new path that brings true, shared prosperity to the state.
Appendix
The way that the U.S. Census Bureau measures and reports on race and ethnicity affects the structure of key data presented in this report. The Household Pulse Survey, which is a new data product, requires a different approach to analysis than the American Community Survey. This appendix provides additional context on these two issues for readers using these data.
Definitions of race and ethnicity
The U.S. Census Bureau, which conducts the American Community Survey (ACS), measures Race and Hispanic or Latino ethnicity as separate concepts. Respondents’ race is categorized as one of the following options:
- White
- Black or African American
- American Indian and Alaska Native (in this report we use Native American)
- Asian
- Native Hawaiian and Other Pacific Islander
- Two or More Races
- Some Other Race
In addition, respondents’ ethnicity is categorized as either Hispanic or Latino or Not Hispanic or Latino. We use the term Latinx in this report.
Because this does not reflect the way that Latinx identity has been racialized in the U.S., researchers often recode these responses so that anyone categorized as Hispanic or Latino is considered Hispanic or Latino and all other race categories only include people who have identified as Not Hispanic or Latino. However, not all combinations of race and ethnicity are available for every ACS table when the data is first released, so we provide additional detail on the categories used in the various figures here.
Figure 2: Poverty rate by race and ethnicity in North Carolina, 2019
- Latinx: Ethnicity is Hispanic or Latino, regardless of race
- White: Race is White, and ethnicity is Not Hispanic or Latino
- All other categories are based on race, regardless of ethnicity
In the ACS data for North Carolina, over 94 percent of people with Hispanic or Latino ethnicity are in the “White,” “Two or More Races,” or “Some Other Race” category, meaning there is very little overlap among the categories in this figure. There is no data for Native Hawaiians and Other Pacific Islanders because their population in North Carolina is too small to provide reliable estimates.
Figure 3: Women’s earnings in North Carolina compared with white men’s earnings in 2019
- Latina women: Ethnicity is Hispanic or Latino, regardless of race
- All other categories only include people whose ethnicity is Not Hispanic or Latino
Figures 7, 10, and 11: Household Pulse Survey data by race
- Latinx: Ethnicity is Hispanic or Latino, regardless of race
- Black and White only include people whose ethnicity is Not Hispanic or Latino
We did not include additional racial categories because the small sample size meant the estimates were unreliable.
Learn more about race and ethnicity in the Census
For more information about how the Census Bureau measures race and the history of these categories, see:
- U.S. Census Bureau. (2020, October 16). About Race. https://www.census.gov/topics/population/race/about.html
- U.S. Census Bureau. (2020, October 16). About Hispanic Origin. https://www.census.gov/topics/population/hispanic-origin/about.html
- Brown, A. (2020, February 25). “The changing categories the U.S. census has used to measure race.” Pew Research Center Fact Tank. https://www.pewresearch.org/fact-tank/2020/02/25/the-changing-categories-the-u-s-has-used-to-measure-race/
- Demby, G. (2014, June 16). On the Census, Who Checks ‘Hispanic,’ Who Checks ‘White,’ and Why. Code Switch. National Public Radio. https://www.npr.org/sections/codeswitch/2014/06/16/321819185/on-the-census-who-checks-hispanic-who-checks-white-and-why
About the Household Pulse Survey
The Household Pulse Survey is an experimental data product from the U.S. Census Bureau. It is designed to rapidly gather and disseminate data on the social and economic effects of the COVID-19 pandemic in order to inform recovery efforts at the state and federal levels.
Phase 2 of the Household Pulse Survey began on Aug. 19, 2020, and releases data every two weeks. Due to small sample size, many of the estimates have very high standard errors. In order to get more reliable estimates, we averaged three data releases. Together, these cover the time from Aug. 19-Sept. 28, 2020.
We reported only results for estimates with a coefficient of variation (CV) under 15 percent, which is why we did not report results for categories of race other than white, Black, and Latinx. The CV is a measure of statistical variability used for analyzing the reliability of an estimate derived from a sample. While there are no specific rules for CV cutoff points, a higher CV indicates a less reliable estimate, and generally a CV of over 30 percent is considered too high. In analyzing this data, we followed guidance from the Center on Budget and Policy Priorities to select a more conservative cutoff of 15 percent.
To calculate percentages, we excluded people who didn’t respond to the question. For individual questions:
Figures 7 and 8: Share of adults reporting difficulty paying for household expenses in the past week
- Includes people who reported it was somewhat or very difficult to pay for usual household expenses in the past seven days.
Figure 9 and 10: Share of adults not confident they can pay next month’s rent
- Includes people who reported they were somewhat or not at all confident they could pay next month’s rent, along with people whose rent payments have been deferred.
Figures 11 and 12: Share of adults reporting their household did not have enough to eat in the past week
- Includes people who reported that they sometimes or often did not have enough to eat in the last seven days.
[1] Rank, Mark R., and Hirschl, Thomas A., (2020.) Most Americans Will Experience Poverty. Confronting Poverty. https://confrontingpoverty.org/poverty-facts-and-myths/most-americans-will-experience-poverty/
[2] American Community Survey income and poverty estimates may have been influenced by the introduction of new survey language in 2019. For the time being, they provide the best comprehensive measures of poverty in 2019, and the Budget & Tax Center is monitoring information about these survey results.
[3] American Community Survey 2019 1-year estimates, Table B17001
[4] Ibid.
[5] Latinx is a gender-neutral term for Latino. In this report, we use Latinx to refer to data described as Latino or Hispanic, unless it refers specifically to women, in which case we use Latina.
[6] Carr, J. H. (2020, March 25). Why Recovery from the Great Recession Favored the Wealthy: The Role of Public Policy. Nonprofit Quarterly. https://nonprofitquarterly.org/why-recovery-from-the-great-recession-favored-the-wealthy-the-role-of-public-policy/
[7] American Community Survey 2019 1-year estimates, Table B17001
[8] United States Bureau of Economic Analysis. (2020, October 2). Annual Gross Domestic Product by State, summary (SAGDP1). https://www.bea.gov/data/gdp/gdp-state.
[9] American Community Survey 2019 1-year estimates, Table B19082
[10] Ibid.
[11] Bivens, J. (2017). Inequality is slowing US economic growth: Faster wage growth for low- and middle-wage workers is the solution. Economic Policy Institute. https://www.epi.org/publication/secular-stagnation/
[12] American Community Survey 2019 1-year estimates, Table B17020; The American Community Survey (ACS) measures “Race” and “Hispanic or Latino ethnicity” as separate concepts. For more detail on how these are measured by the ACS and used in this report, see the Appendix.
[13] American Community Survey 2019 1-year estimates, Table B17001
[14] Bleiwies, R., Boesch, D., Cawthorne Gaines, A. (2020, August 3). The Basic Facts About Women in Poverty. Center for American Progress. https://www.americanprogress.org/issues/women/reports/2020/08/03/488536/basic-facts-women-poverty/
[15] Ibid.
[16] Pedersen, L. (2020, June 16). Women more likely than men to file for unemployment in 2020. North Carolina Justice Center. https://www.ncjustice.org/publications/women-more-likely-than-men-to-file-for-unemployment-in-2020/
[17] Frye, J. (2020, April 23). On the Frontlines at Work and at Home: The Disproportionate Economic Effects of the Coronavirus Pandemic on Women of Color. Center for American Progress. https://www.americanprogress.org/issues/women/reports/2020/04/23/483846/frontlines-work-home/
[18] National Partnership for Women and Families. (2020). Fathers Need Paid Family and Medical Leave. https://www.nationalpartnership.org/our-work/resources/economic-justice/paid-leave/fathers-need-paid-family-and-medical-leave.pdf
[19] American Community Survey 2019 1-year estimates, Table B17006
[20] American Community Survey 2019 1-year estimates, Table B17001
[21] U.S. Department of Health & Human Services. (n.d.). 2019 Poverty Guidelines. https://aspe.hhs.gov/2019-poverty-guidelines; Technically the Census Bureau uses a different measure, called poverty thresholds, which are adjusted based on the age of family members. The simplified federal poverty guideline is the most common measure of poverty, which is why we use it here. For more detail, see U.S. Census Bureau, August 2020. “How the Census Bureau Measures Poverty.” https://www.census.gov/topics/income-poverty/poverty/guidance/poverty-measures.html
[22] Kennedy. B. (2019, March 27) A Standard Worthy of North Carolina Workers: The 2019 Living Income Standard for 100 Counties. North Carolina Justice Center. https://www.ncjustice.org/publications/the-2019-living-income-standard-for-100-counties/
[23] Ibid.
[24] American Community Survey 2019 1-year estimates, Table B17002
[25] Khullar, D., & Choski, D. (2018). Health, Income, & Poverty: Where We Are & What Could Help. Health Affairs. https://doi.org/10.1377/hpb20180817.901935
[26] Prosperity Now. (2020, September 3). Financial Assets and Income: Liquid Asset Poverty Rate. https://scorecard.prosperitynow.org/data-by-issue#finance/outcome/liquid-asset-poverty-rate
[27] Ibid. (2020). State Outcome Report: North Carolina. https://scorecard.prosperitynow.org/data-by-location
[28] Ibid.
[29] Hanks, A., Solomon, D., & Weller, C. E. (2018). Systematic Inequality: How America’s Structural Racism Helped Create the Black-White Wealth Gap. Center for American Progress. https://www.americanprogress.org/issues/race/reports/2018/02/21/447051/systematic-inequality/
[30] Reid, C. K., Bocian, D., Li, W., & Quercia, R. G. (2017). Revisiting the subprime crisis: The dual mortgage market and mortgage defaults by race and ethnicity. Journal of Urban Affairs, 39(4), 469–487. https://doi.org/10.1080/07352166.2016.1255529
[31] Sherman, Arloc. (2016, August 9). After 1996 Welfare Law, a Weaker Safety Net and More Children in Deep Poverty. Center on Budget and Policy Priorities. https://www.cbpp.org/family-income-support/after-1996-welfare-law-a-weaker-safety-net-and-more-children-in-deep-poverty
[32] Fox, L. (2020, September) The Supplemental Poverty Measure: 2019. U.S. Census Bureau. https://www.census.gov/content/dam/Census/library/publications/2020/demo/p60-272.pdf
[33] Rank, M., & Hirschl, T. (2020). Most Americans Will Experience Poverty. Confronting Poverty. https://confrontingpoverty.org/poverty-facts-and-myths/most-americans-will-experience-poverty/
[34] Mayo Clinic. (2019, March 19). Chronic Stress Puts Your Health at Risk. https://www.mayoclinic.org/healthy-lifestyle/stress-management/in-depth/stress/art-20046037
[35] Blair, C., & Raver, C.C. (2016). Poverty, Stress, and Brain Development: New Directions for Prevention and Intervention. Academic Pediatrics, 16(3 Suppl), S30–S36. https://doi.org/10.1016/j.acap.2016.01.010
[36] U.S. Census Bureau. (2020). Household Pulse Survey Phase 2: Measuring Social and Economic Impacts During the Coronavirus Pandemic. https://www.census.gov/programs-surveys/household-pulse-survey.html. For additional details on this survey and the analysis in this report, see the Appendix
[37] National Immigrant Law Center. (2020, July 21). Congress Urged to Include Tax-paying Immigrant Families in Next COVID-19 Relief Bill. https://www.nilc.org/2020/07/21/congress-urged-to-include-tax-paying-immigrant-families-in-next-covid-19-relief-bill/
[38] Artiga, S., & Rae, M. (2020). Health and Financial Risks for Noncitizen Immigrants due to the COVID-19 Pandemic. Kaiser Family Foundation. https://www.kff.org/racial-equity-and-health-policy/issue-brief/health-financial-risks-noncitizen-immigrants-covid-19-pandemic
[39] National Low Income Housing Coalition. (2020). Housing Needs By State: North Carolina. https://nlihc.org/housing-needs-by-state/north-carolina; “Extremely low income” (ELI) is an income limit used to determine eligibility for housing assistance. ELI refers to a household that makes less than 30 percent of the area median income in a given region, or less than the federal poverty level, whichever is higher. The estimated maximum income for a four-person ELI household in 2020 in North Carolina is $25,100.
[40] American Community Survey 2019 1-year estimates, Table B17001
[41] Ibid.
[42] U.S. Census Bureau Household Pulse Survey Phase 2, Housing Table 3b.
[43] Woomer-Deters, K. (2020, September 9) New Federal Eviction Moratorium: Does It Apply to Me? North Carolina Justice Center. https://www.ncjustice.org/publications/new-federal-eviction-moratorium-does-it-apply-to-me/
[44] National Low Income Housing Coalition. (2020, October 13). Trump Administration Issues CDC Eviction Moratorium Guidance to Benefit Landlords over Renters. https://nlihc.org/resource/trump-administration-issues-cdc-eviction-moratorium-guidance-benefit-landlords-over
[45] Gundersen, C. & Ziliak J.P. Food Insecurity and Health Outcomes. Health Affairs. (34)11. https://doi.org/10.1377/hlthaff.2015.0645
[46] North Carolina Department of Health and Human Services. (2020.) Food and Nutrition Service Cases and Participants. https://www.ncdhhs.gov/divisions/social-services/program-statistics-and-reviews/fns-caseload-statistics-reports
[47] Long, H. (2020, August 13). The recession is over for the rich, but the working class is far from recovered. Washington Post. https://www.washingtonpost.com/road-to-recovery/2020/08/13/recession-is-over-rich-working-class-is-far-recovered/
[48] Ibid.
[49] Narea, N. (2020, May 5). For immigrants without legal status, federal coronavirus relief is out of reach. Vox. https://www.vox.com/2020/5/5/21244630/undocumented-immigrants-coronavirus-relief-cares-act
[50] Holtzblatt, J., & Karpman, M. (2020). Who Did Not Get the Economic Impact Payments by Mid-to-Late May, and Why? Tax Policy Center. https://www.taxpolicycenter.org/publications/who-did-not-get-economic-impact-payments-mid-late-may-and-why
[51] Special data request to the Southern Economic Advancement Project
[52] Parolin, Z., Curran, M., Matsudaira, J., Woldfogel, J. & Wimer, C. (2020, October 15). Monthly Poverty Rates in the United States during the COVID-19 Pandemic. Center on Poverty & Social Policy, Columbia University. https://www.povertycenter.columbia.edu/news-internal/2020/covid-projecting-monthly-poverty
[53] American Community Survey 2019 1-year estimates, Table B17016
[54] Golden, L., & Kim, J. (2020). The Involuntary Part-time Work and Underemployment Problem in the U.S. CLASP. https://www.clasp.org/publications/report/brief/involuntary-part-time-work-and-underemployment-problem-us
[55] The Charlotte-Mecklenburg Opportunity Task Force Report. (2017). Leading On Opportunity. https://www.leadingonopportunity.org/report/introduction
[56] Pathways For Prosperity. (2020). https://www.pathwaysforprosperity.org/
[57] Nichol, G., & Hunt, H. (2016). Economic Hardship, Racialized Concentrated Poverty, and the Challenges of Low-Wage Work: Charlotte, North Carolina. NC Poverty Research Fund. https://www2.law.unc.edu/documents/poverty/publications/charlottepovertyreport_final.pdf
[58] N.C. Second Chance Alliance. (2020). https://ncsecondchance.org/
[59] NC Black Leadership and Organizing Collective. (2020). http://www.ncbloc.black/
[60] About Down Home NC. (2020). Down Home North Carolina. https://downhomenc.org/about-us/
[61] Latinx-Led Mutual Aid Funds Fill Gaps, Meet Critical Community Needs During COVID-19. (2020, August 7). Kate B. Reynolds Charitable Trust. https://kbr.org/news/latinx-led-mutual-aid-funds-fill-gaps-meet-critical-community-needs-during-covid-19/
[62] Poverty Amidst Pandemic: A Moral Response to COVID-19. (2020, June 13). Poor People’s Campaign. https://www.poorpeoplescampaign.org/resource/poverty-amidst-pandemic-resources/
[63] Leachman, M. Mitchel, M., Johnson, N., Williams, E. (2018, November 15). Advancing Racial Equity with State Tax Policy. Center on Budget and Policy Priorities. https://www.cbpp.org/research/state-budget-and-tax/advancing-racial-equity-with-state-tax-policy