 Endowment
By removing the barriers to economic prosperity experienced by North Carolinians who historically have been excluded, our whole state can thrive.
In the wealthiest nation on earth, millions of North Carolinians spend every day just trying to survive. Low wages, lack of investment in an infrastructure of opportunity, and an economy with rules rigged for the wealthy few have resulted in the lucky few amassing unimaginable wealth while children and families go hungry and struggle to get ahead. This moral and economic failure touches people across the state and is particularly present in communities of color that have long faced barriers to prosperity and security erected through policy choices and systems of exclusion.
Poverty is a national problem, but it is a particularly acute crisis in North Carolina. Amid an economic recovery that has taken nearly a decade to bring poverty back to pre-Recession levels, poverty in North Carolina is still worse than in 35 states. More than 1.4 million North Carolinians lived in poverty last year.1
The prevalence of poverty has nothing to do with a lack of wealth; it is the direct consequence of setting up rules for economic life that drive income to the top and withhold supports from people struggling with too little to make ends meet. The richest 5 percent of North Carolina households have an average income 28 times greater than the poorest fifth.2 More than half of the income in the state in 2018 was held by the top 20 percent of North Carolinians.3
Given the wealth that exists, the rise in incomes, and the current expansion of the economy, it is possible to make different choices that result in better, more equitable economic outcomes. Such outcomes require our policies — and policymakers — to remain oriented to the goal of supporting the well-being of every North Carolinian, not just the few. Improved outcomes require a collective commitment to each other and the investment of public dollars to build systems that include and support solid pathways to well-being.
The prevalence of poverty has nothing to do with a lack of wealth; it is the direct consequence of setting up rules for economic life that drive income to the top and withhold supports from people struggling with too little to make ends meet.
The latest data on poverty in North Carolina shows the lasting effects, both on our communities and our economy, of failing to improve economic outcomes. When we continue to exclude Black and brown North Carolinians through public policy choices and the design of public programs from the chance to connect to greater economic opportunity, the benefits to white North Carolinians get consolidated. The right to own property, to access quality education, to practice professions, and to purchase homes have been blocked from the reach by people of color in North Carolina and across the country now and throughout history.
In 2018, the imprint of these past policy choices and practices that still persist are clearly visible in poverty rates: Poverty rates for Black North Carolinians (21 percent), American Indian North Carolinians (20 percent), and Latinx North Carolinians (25 percent) were at least two times the poverty rate of whites (10 percent).4
The benefits of pursuing economic outcomes that support the accumulation of savings and assets, the promotion of healthier outcomes, engagement in civic life, and the advancement of opportunity for all, in each of our communities and across generations are real. They must be pursued with attention to what is needed for groups who historically have been excluded so that we all benefit from the boosts that come with overcoming decades of roadblocks.
Elevated poverty for Black, Latinx, and American Indian North Carolinians, women, and people with disabilities is not just a moral problem; it undermines the economic system that everyone relies upon. What many white, able-bodied men often fail to recognize is how the dramatic income inequality that traps so many families in poverty undermines the health of our entire economy. Ours is an economy that rises and falls on the ability of consumers to spend, so when millions of North Carolinians can’t make ends meet, it prevents the economic engine from running at its full potential.
This report details the state of poverty in North Carolina, specifically analyzing the American Community Survey from 2018 to describe who experiences hardship and where poverty is most concentrated in the state, while quantifying the benefits of reversing those trends.
Analysis of the latest data and a review of ongoing research in the field demonstrate the opportunity for our state should we embrace the goal of reducing the harm of poverty and hardship. This report outlines the broad-based benefits of removing the barriers to economic prosperity experienced by North Carolinians based on the color of their skin, the zip code they live in, and their age.
The findings of this report should serve as a call to every North Carolinian in 2020 to turn the tide on economic hardship and advance the collective solutions through public policy that can ensure each and every one of our neighbors has not only the opportunity, but the right to a good quality of life.
The recovery hasn’t reduced hardship for all North Carolinians
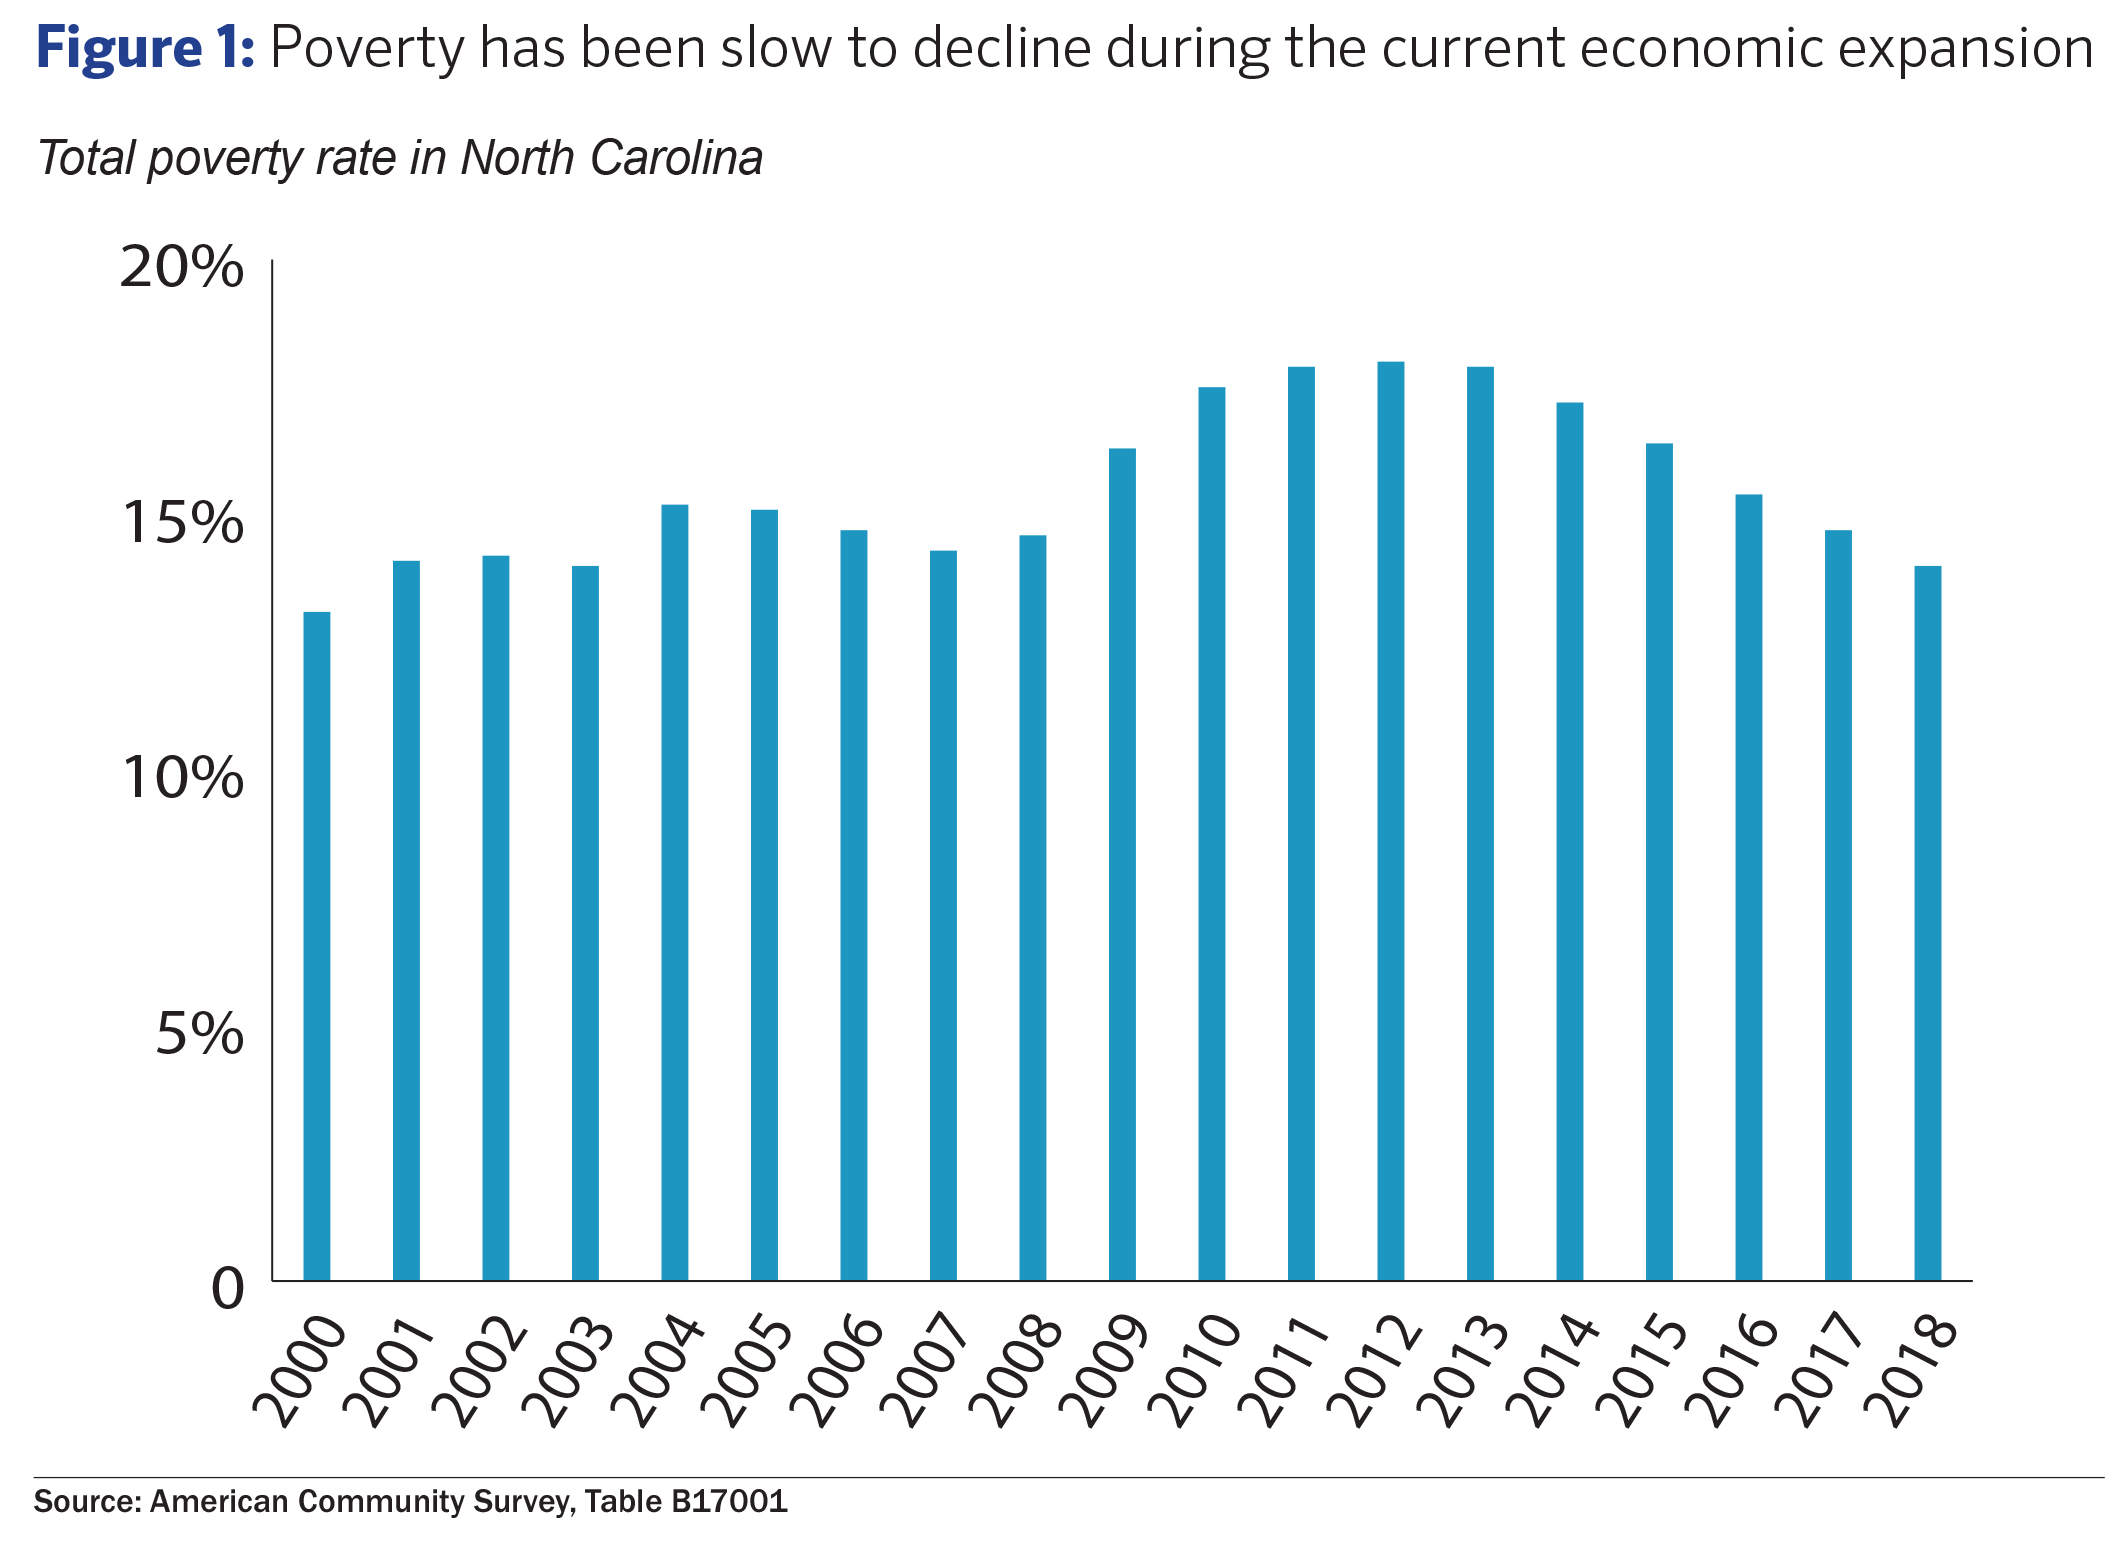
In 2018, 14 percent of North Carolinians struggled to make ends meet as measured by the meager federal poverty level, which was $25,100 annually for a family of four.5 By our market-based measure of what it actually takes to meet the basic needs of a family of four in North Carolina on average, this threshold falls short by half.6
As is clear in Figure 1, it took 10 years for North Carolina to reach pre-Recession levels of poverty after the Great Recession, which began in 2007. This is more than 3 times the number of years it took after the 2001 recession for North Carolina to see its poverty rate decline with an economic expansion.
North Carolina has not been alone in the experience of an economic expansion that has failed to reduce economic hardship quickly. Across the nation, researchers have documented the unique nature of the recovery that began in 2009 for its slow and ineffective work to bring down economic hardship by delivering good jobs to those looking for work and ensuring adequate policy responses.7
The duration of poverty matters
The sad fact is that poverty touches a much larger share of families and people than the snapshot in time that one survey can capture. In an economy where so many working people have no economic cushion, one bad break means falling below the poverty line.
North Carolina’s experience of the recession and recovery demonstrated all too well the proximity to hardship where people live each day. Nearly half of the nation’s population is likely to experience poverty before the age of 65.8 Not only are the numbers of near-poor (those with incomes just above the federal poverty level with incomes in the 100 to 125 percent range) 9 percent higher for North Carolina in 2018 compared to 20089, the increasing volatility of income presents a growing challenge to sustaining moves out of poverty.10 Indeed, researchers looking at the period between 2004 and 2007, a period of relative expansion in the 2000s, found that:
32 percent of Americans had at least one spell of poverty lasting two or more months. During the same period, chronic poverty was relatively low with only 2.2 percent of Americans living in poverty for the entire period.11
Spells of poverty thus appear more widespread than the topline figures suggest based on a moment in time. Research is clear that the longer the experience of poverty — for individuals and communities — the greater the barrier to moving out of poverty.12 As will be discussed in greater detail below, the experience of poverty in childhood and early childhood is particularly damaging for children’s economic mobility and well-being.13
Barriers to leaving poverty remain high for people of color
The experience of the recovery may have been unique when compared to other expansions in recent history, but it also followed from a recession that was deeper and notably uneven in its impacts across racial and ethnic groups. As national researchers found in their review of poverty trends by racial and ethnic groups:
Although a recession entails extra risks for most everyone, it is especially dangerous for those who, even in good economic times, are in a precarious economic situation.14
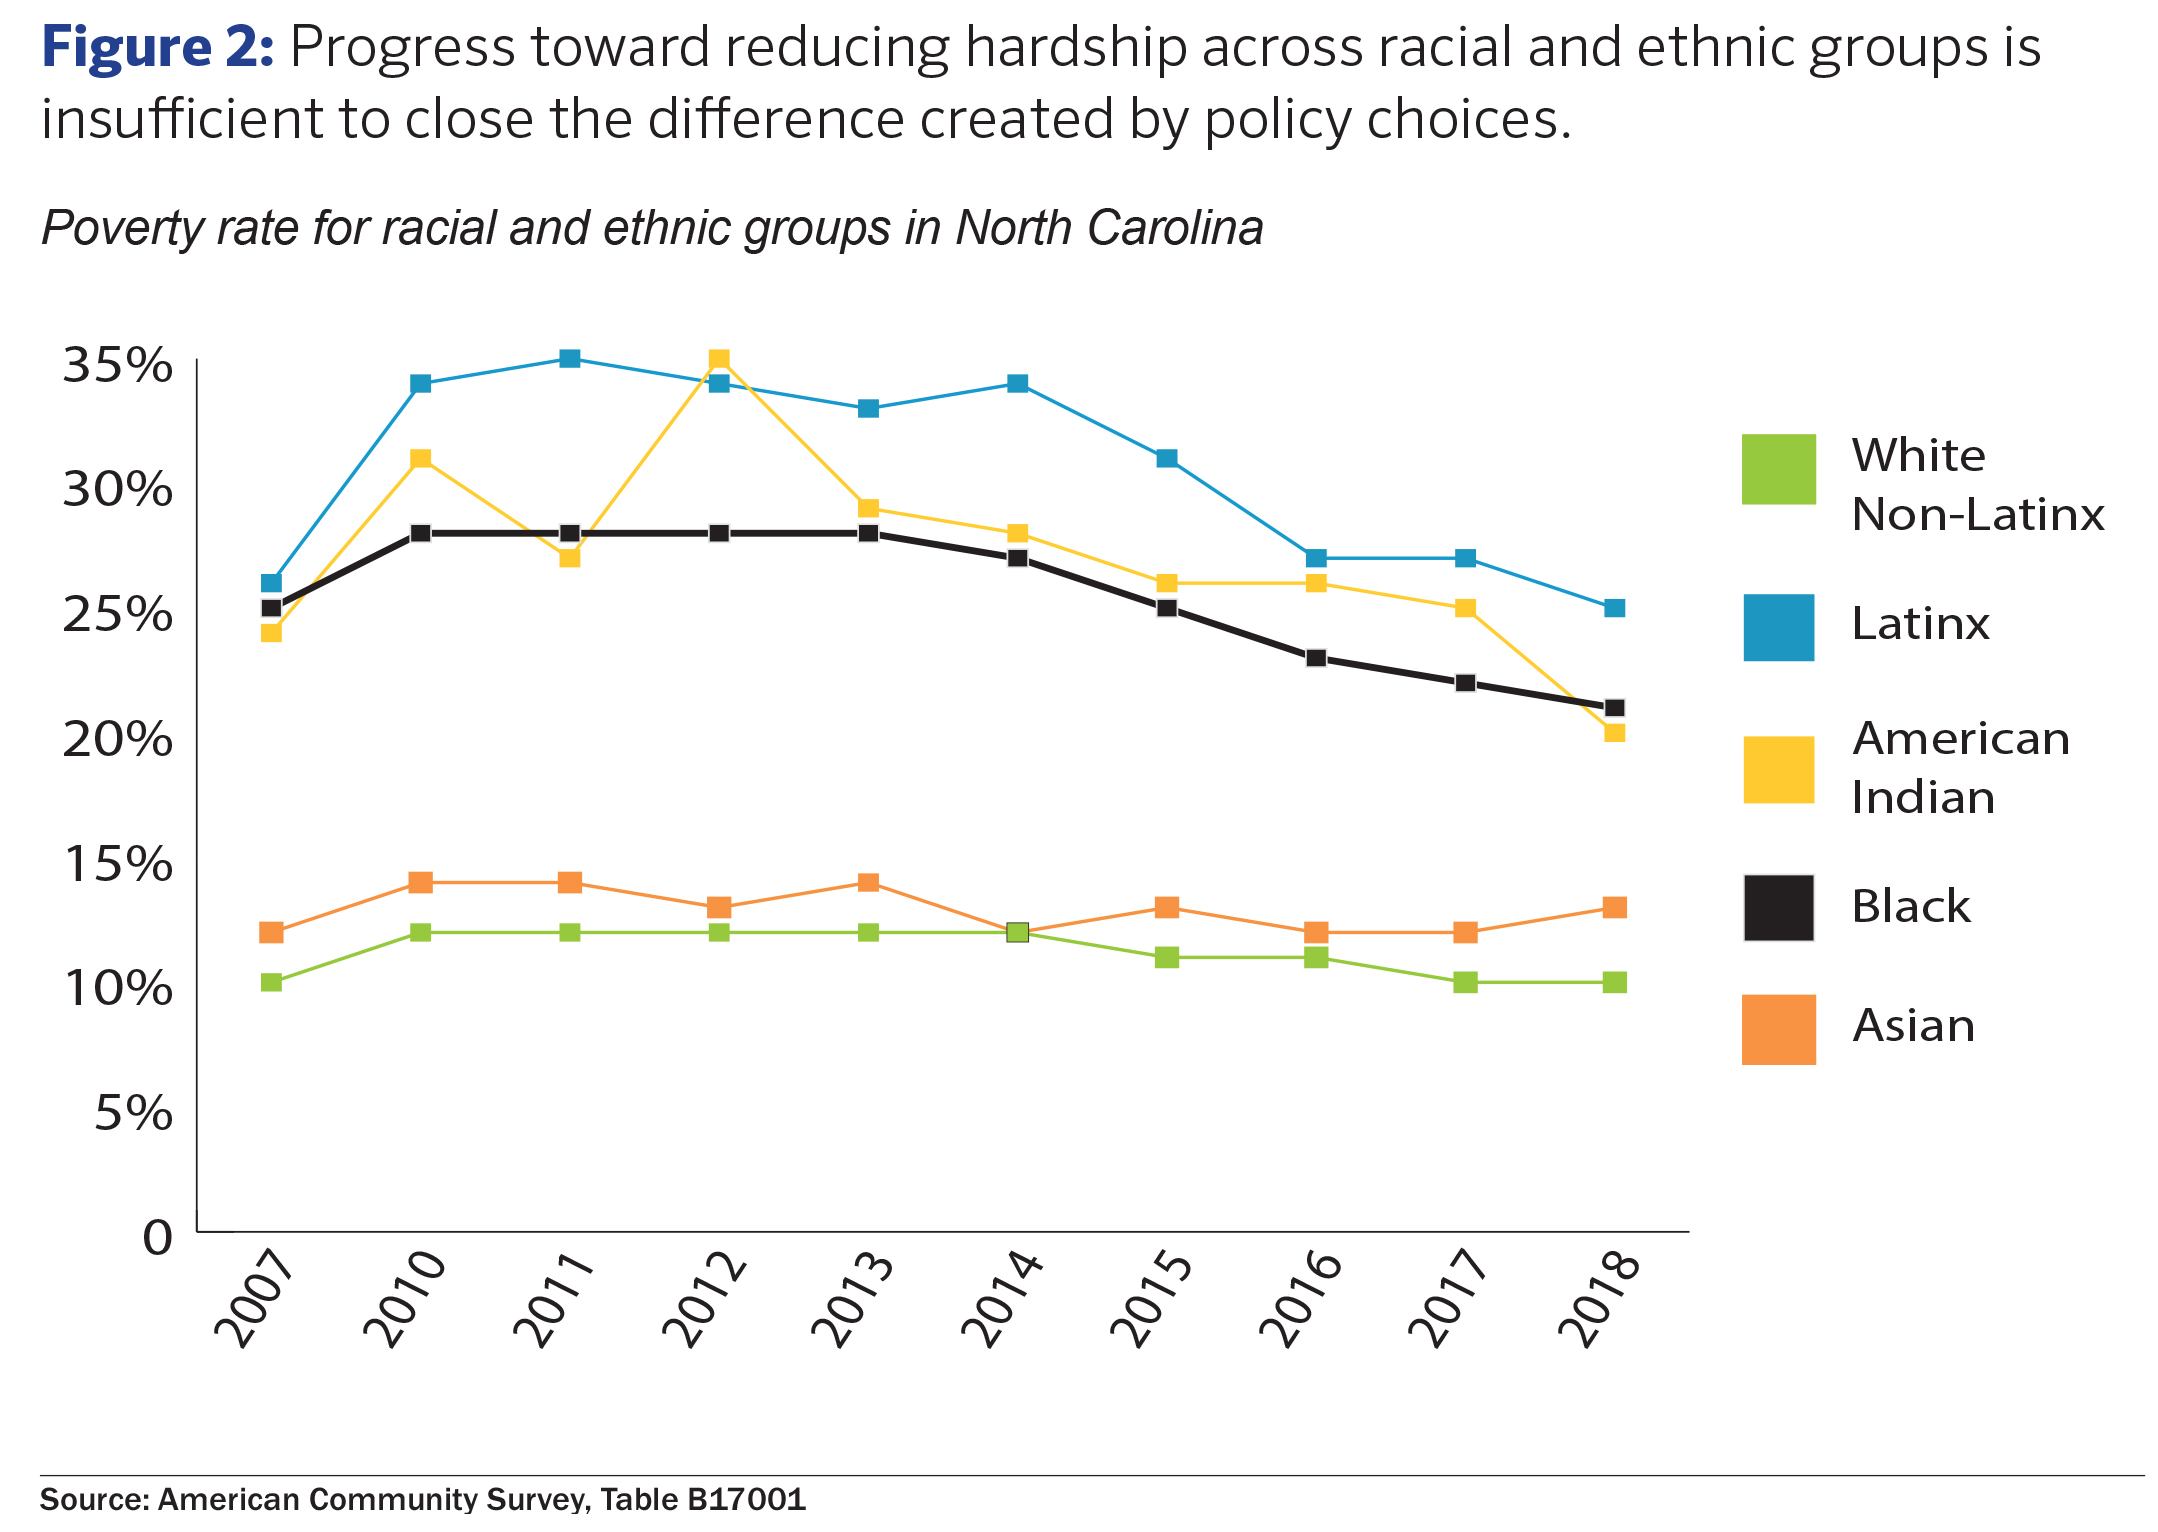
The poverty rates for North Carolinians of color continue to remain elevated above those rates experienced by white North Carolinians. As shown in Figure 2, the poverty rate for Black North Carolinians in 2018 was 21 percent, for Latinx North Carolinians 20 percent, and for American Indian North Carolinians 25 percent — compared to the 10 percent rate of poverty experienced by whites in N.C.15
The decline in poverty rates has closed the difference in rates between Blacks and whites from 15 percentage points in 2007 to an 11 percentage point difference in 2018. At this pace, it would take more than 16 years to eliminate the difference, assuming no other factors or decisions block progress. Such a difference in experiences, forged over generations through policies of exclusion, could be closed with intentional effort to the benefit of all North Carolinians — people of color and white.
► If Asians in North Carolina experienced the same poverty rate as whites (9.8 percent), then 8,800 fewer people would live in poverty.
► If Black people in North Carolina experienced the same poverty rate as whites (9.8 percent), then 240,900 fewer people would live in poverty
► If American Indian people in North Carolina experienced the same poverty rate as whites
(9.8 percent), then 12,000 fewer people would live in poverty.
► If Latinx people in North Carolina experienced the same poverty rate as whites (9.8
percent), then 145,500 fewer people would live in poverty.
Fewer people living in poverty means improved health outcomes, a larger and more stable middle class, more resilient and thriving communities, increased economic mobility across generations, and strengthened democracy.16 By focusing on poverty, North Carolina can advance many of its priorities for our state in the near future and long term — priorities that will improve the quality of life and well-being for each of us.
Broader labor market realities contribute to trends in persistent hardship
A key part of the story of hardship in North Carolina and across the country — and the particular ways in which the shift from the country’s cash assistance program for those struggling to a block grant program to states with time-limited services (See Breakout Box 12) hurt prospects for improved economic well-being — is connected to the role that employment and employment equity plays in securing a household’s financial security.17 A host of research has shown that work continues to be a necessary but insufficient condition to strengthen the economic well-being of households.
Working poverty persists across the country, but it is particularly acute in the South where a legacy of low-wage work and failure to value the productivity of workers has held incomes down for all workers and has reinforced policy choices that keep wage standards low.18 According to the Working Poor Families Project, the most recent data from 2015 finds that North Carolina ranks 16th for the share of families who are working and living below the federal poverty line, at 55 percent.19 One in 8 working families in North Carolina lives below the federal poverty level.20
The most recent data on individuals working in North Carolina from the 2018 American Community Survey finds that nearly 1 in 4 North Carolinians who worked in the past year lived in poverty.21 These findings are consistent with the documented growth in low-wage occupations that fall short of providing the income necessary for families to make ends meet or get ahead. Coupled with the lack of accessible and affordable skills training and barriers to connecting to where jobs are growing — because housing nearby is unaffordable and transportation networks are weak — too many workers in North Carolina struggle to get by.
Stagnant household income keeps poverty high
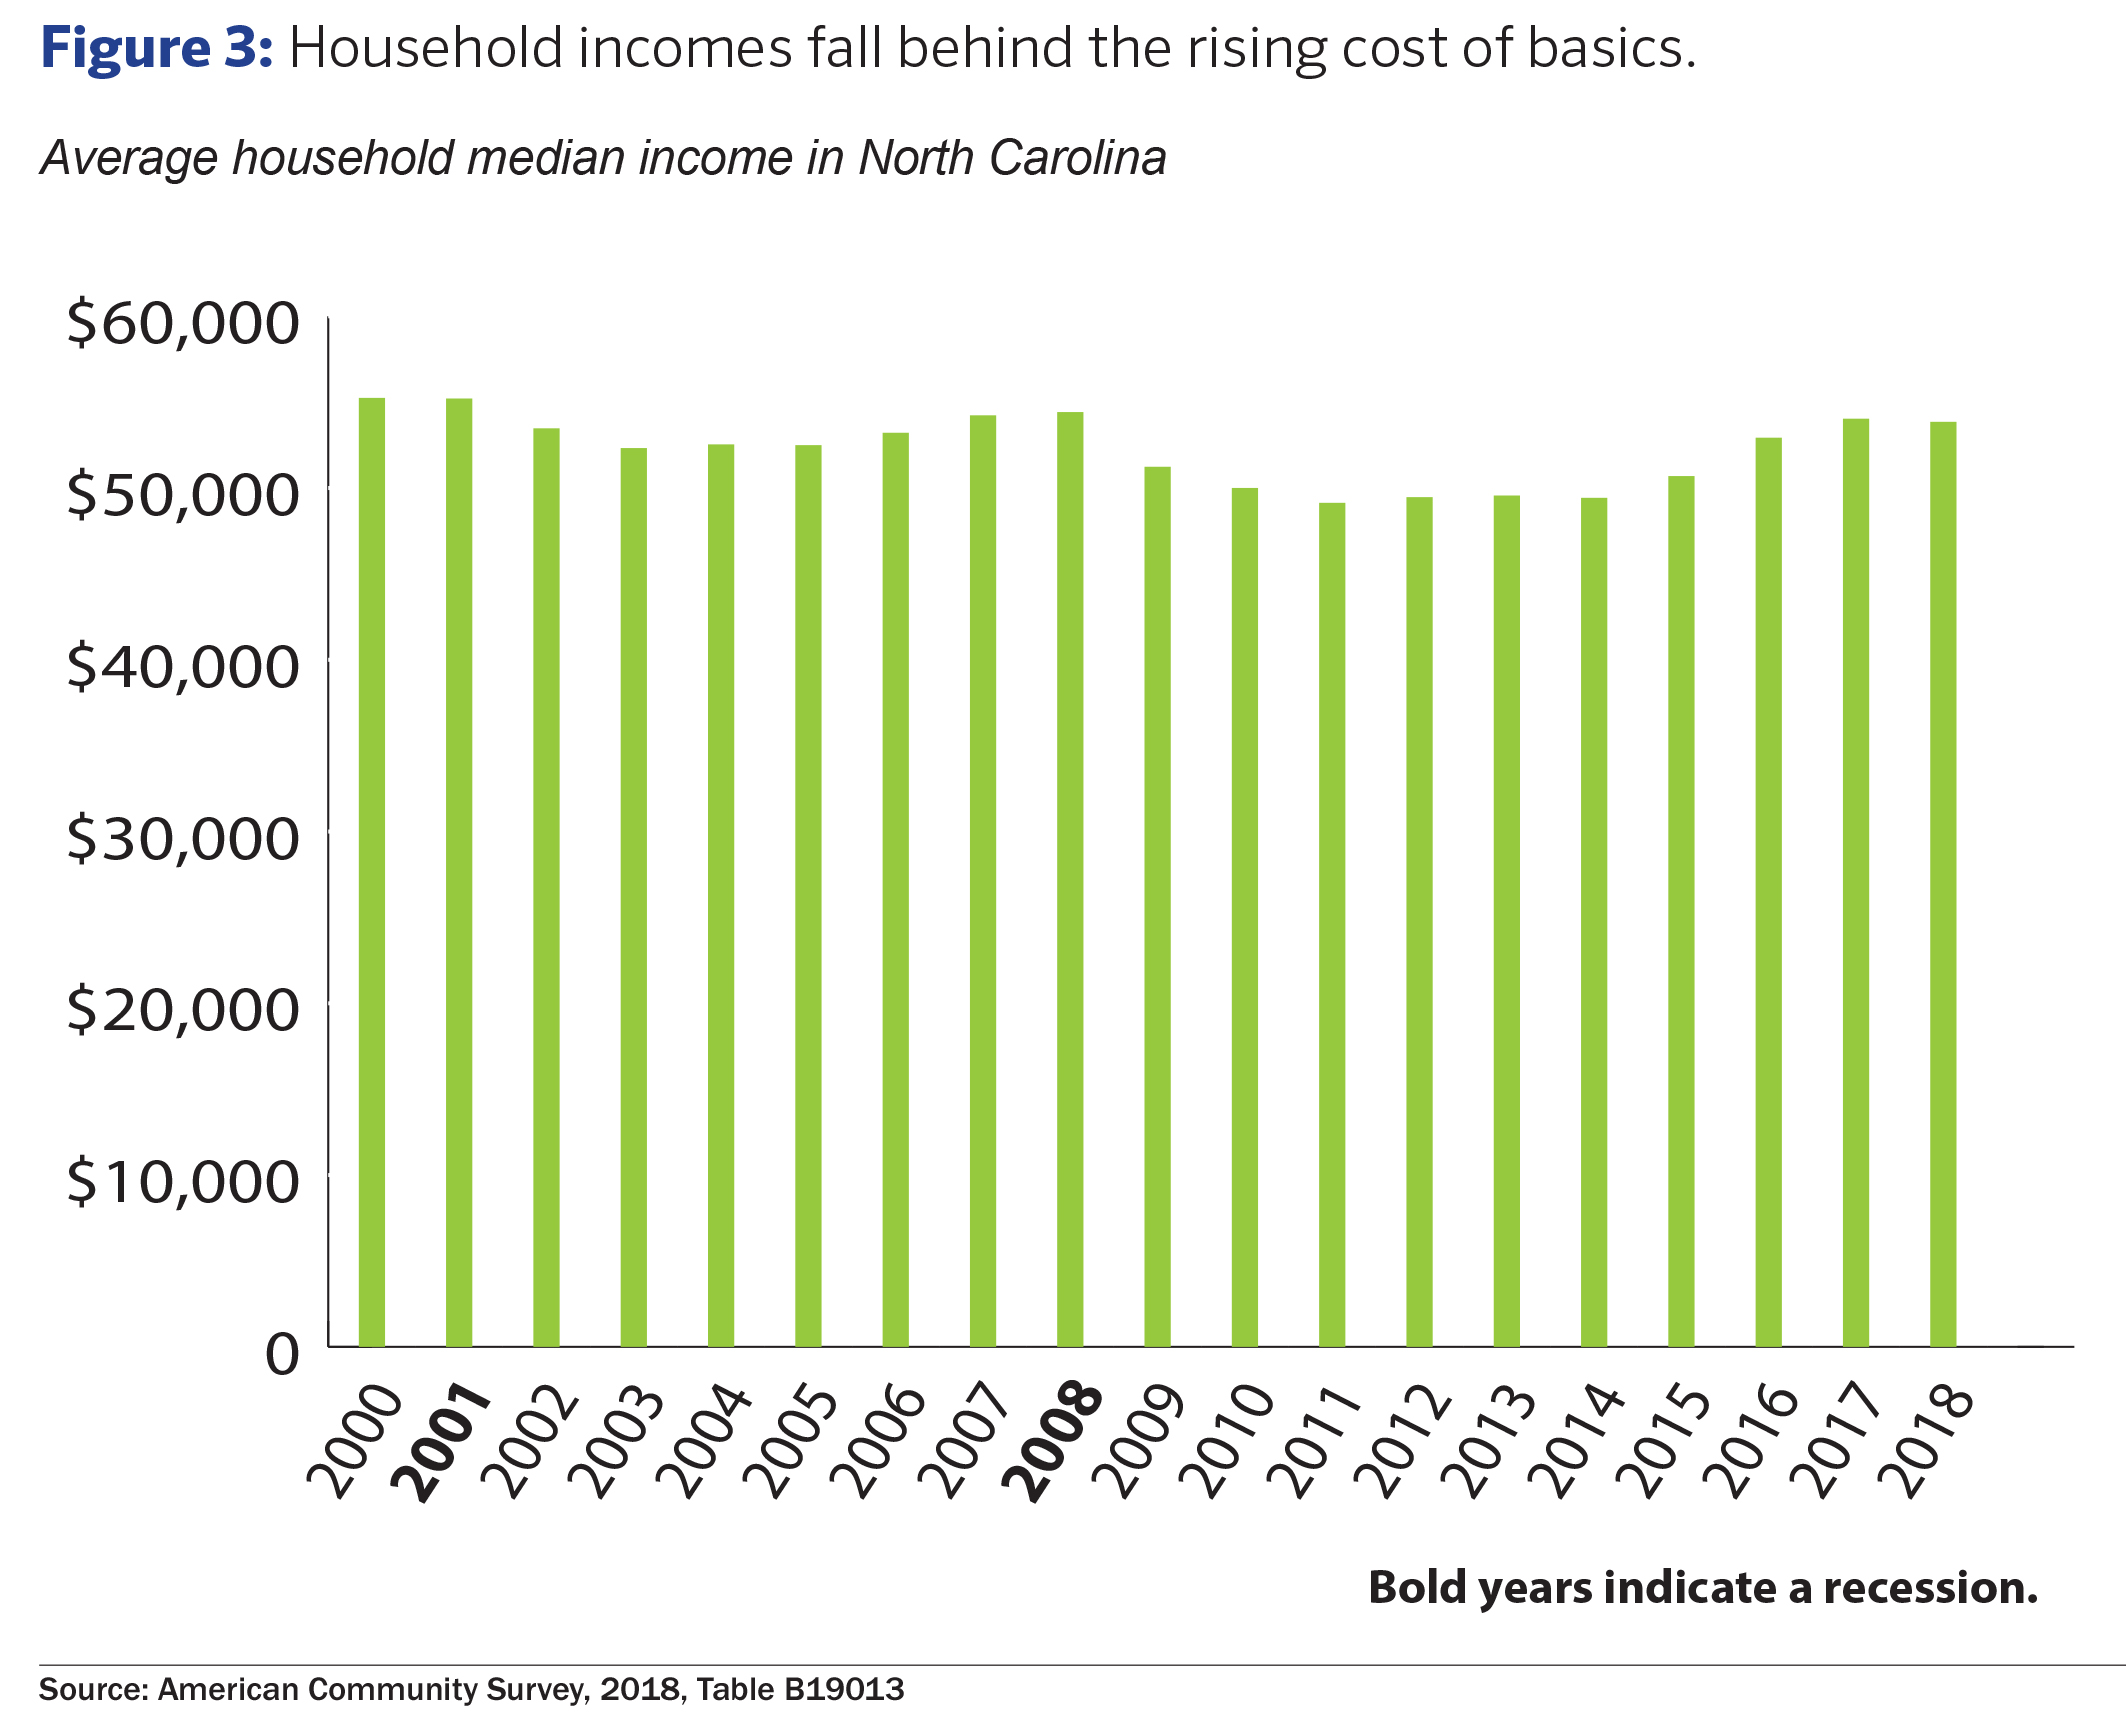
In 2018, the typical household in North Carolina had $53,855 in income, statistically unchanged from 2017 and down $2,000 from 2000.22 While households have failed to grow, the costs for the basic necessities have not. New research from the Groundwork Collaborative and Center on Poverty and Social Policy at Columbia University finds that the bottom of the income distribution experiences faster growth in the prices of goods and services than the top23, building on prior work that documented the higher prices that the poor paid for food, car insurance, and banking.24 When household incomes fail to sufficiently keep up with the costs of the basics, households are hit by the double whammy of an inability to afford the basics and maintain a standard of living that prior income levels established.
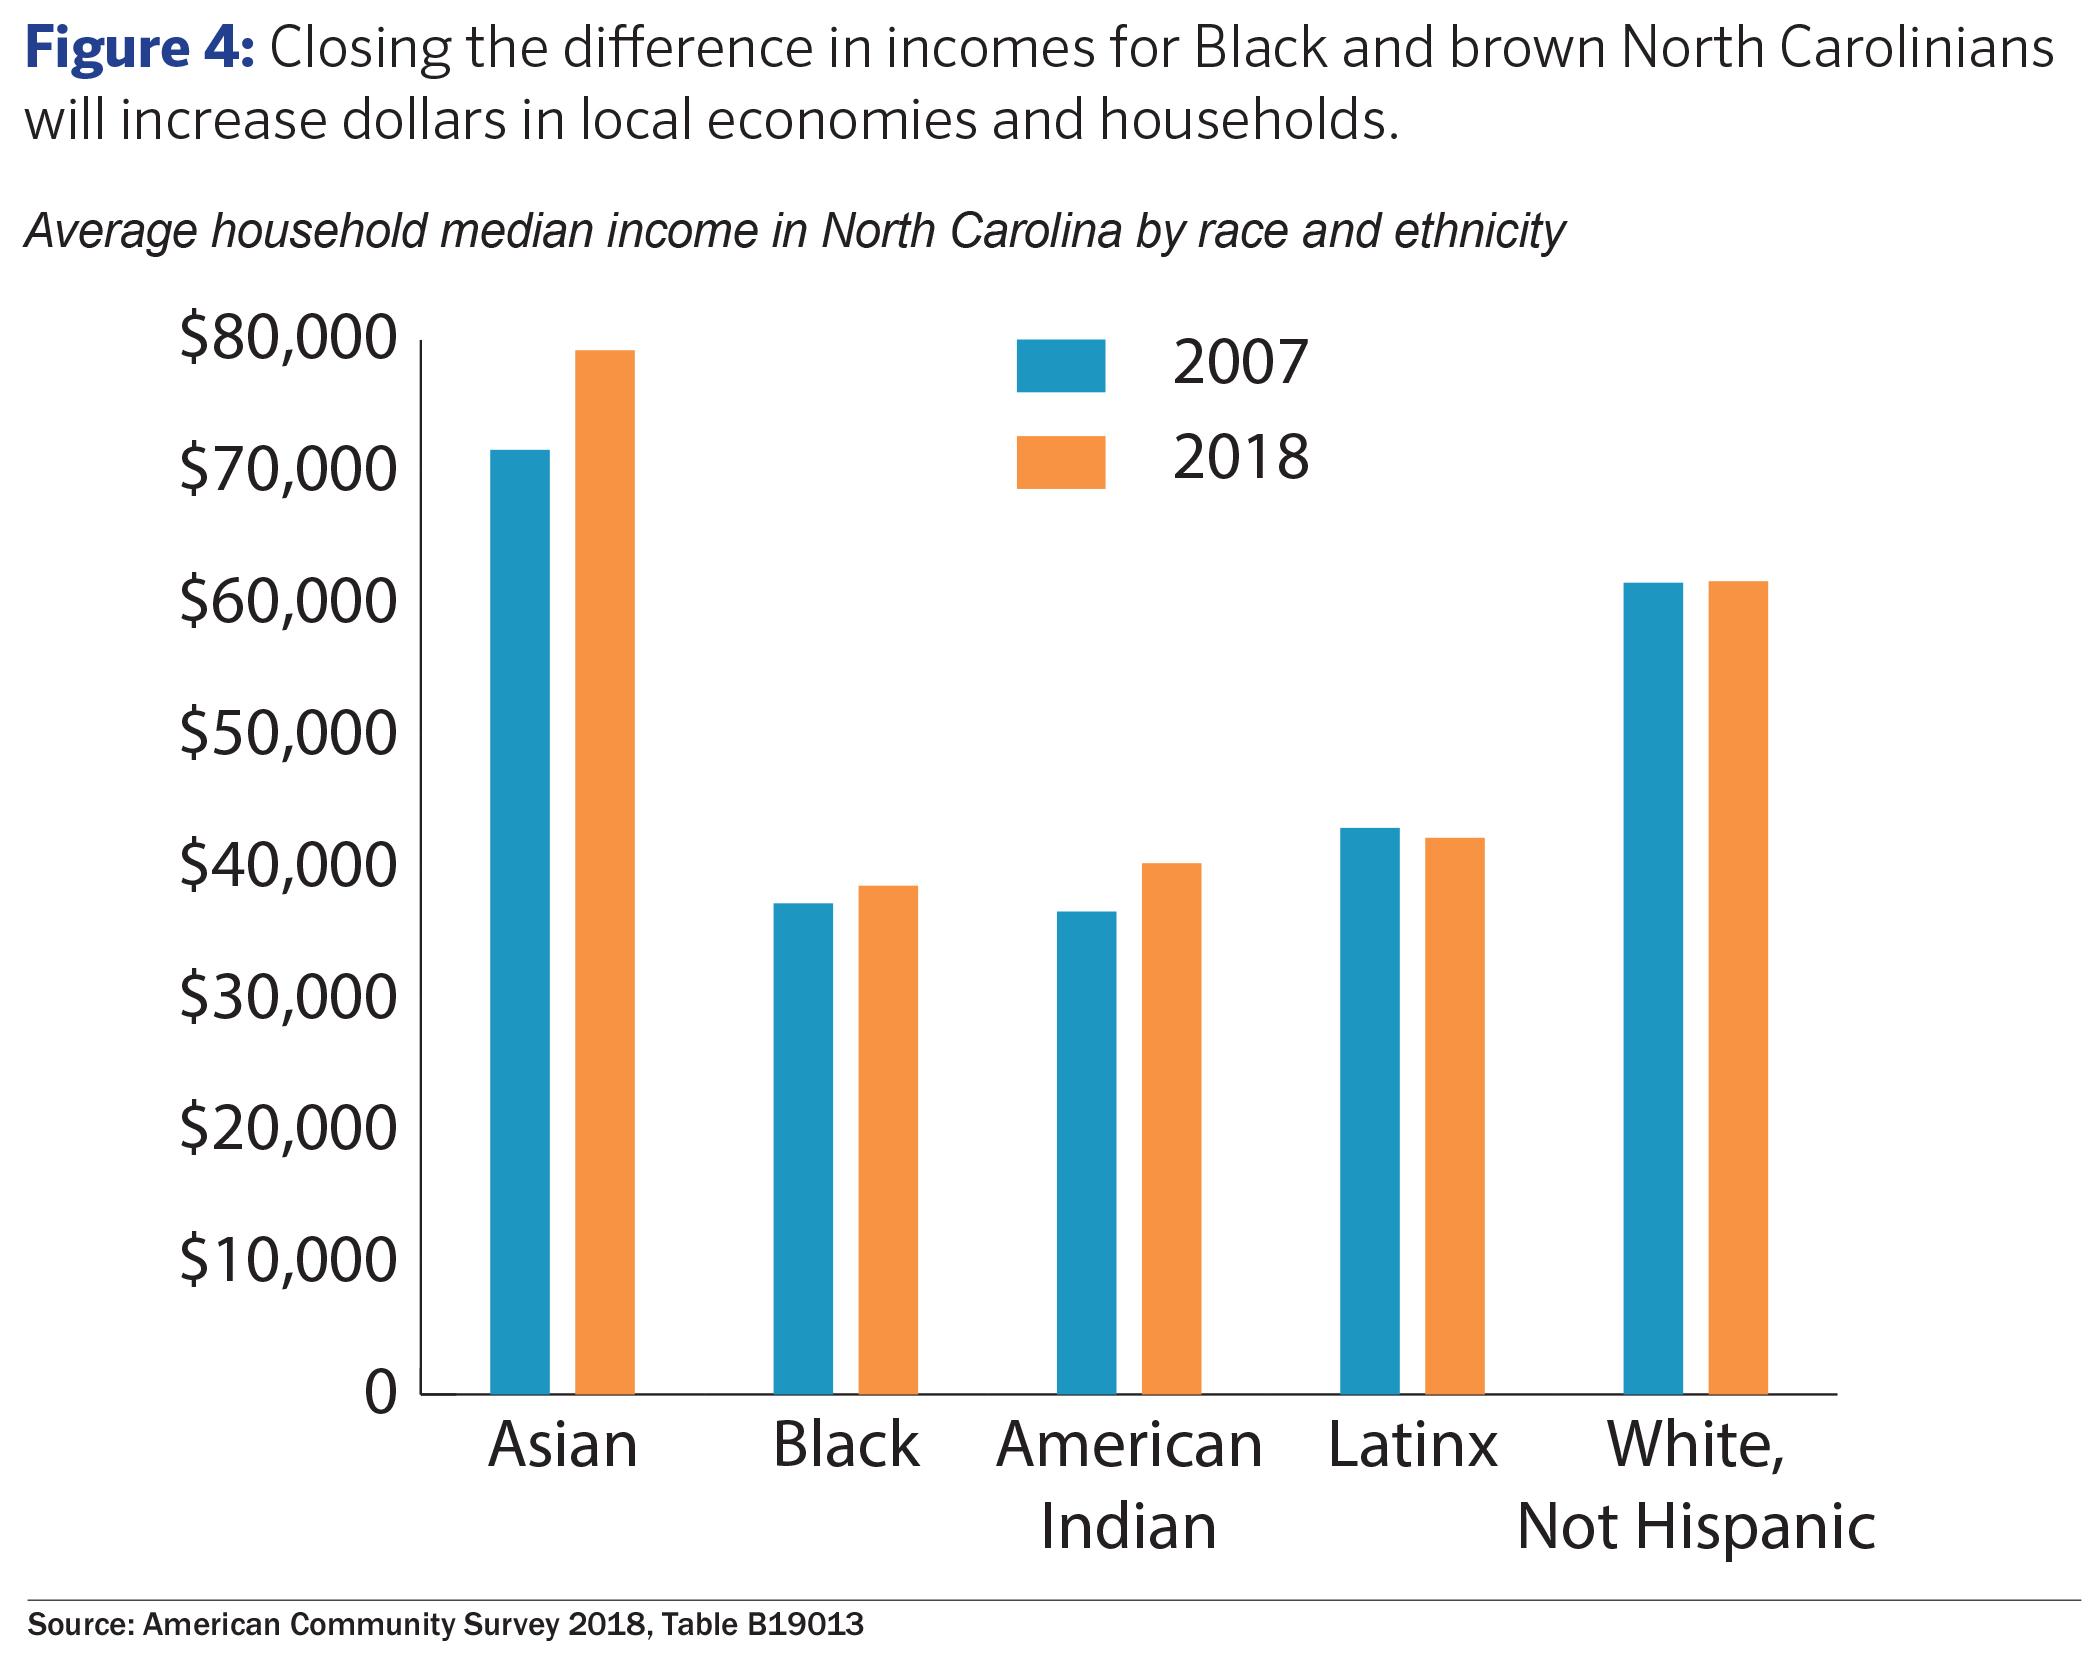
For the past decade, from 2008 to 2018, median household income by racial and ethnic groups continued to mirror historic differences between the income levels of white households and households of color in the state (see Figure 4). The modest growth in median household income over this period for Latinx, Black and American Indian North Carolinians was insufficient to reach the level of income held by white households. By closing the difference in median household income, Black households at the median in North Carolina would have $23,000 more dollars each year, American Indian households would have $21,400 more and Latinx households $19,400 more, thus providing greater opportunities to meet basics and circulate more dollars locally.
The level of income in a household has been linked to a host of important well-being measures, not just the reduction in poverty. Researchers have found that higher levels of household income are connected to educational attainment and accumulation of assets through homeownership or savings. Higher levels of income provide households with the ability to protect against the shocks of a market economy.
In addition, researchers have found a link between higher income and better childhood outcomes,25 lower infant mortality,26 and longer life expectancy.27 Researchers have also noted that the importance of income to these outcomes is as much about the absolute level of money need to support healthier outcomes as well as the role that income plays in establishing a person’s social position.28
Policy changes have compounded hardship and blocked pathways out of poverty
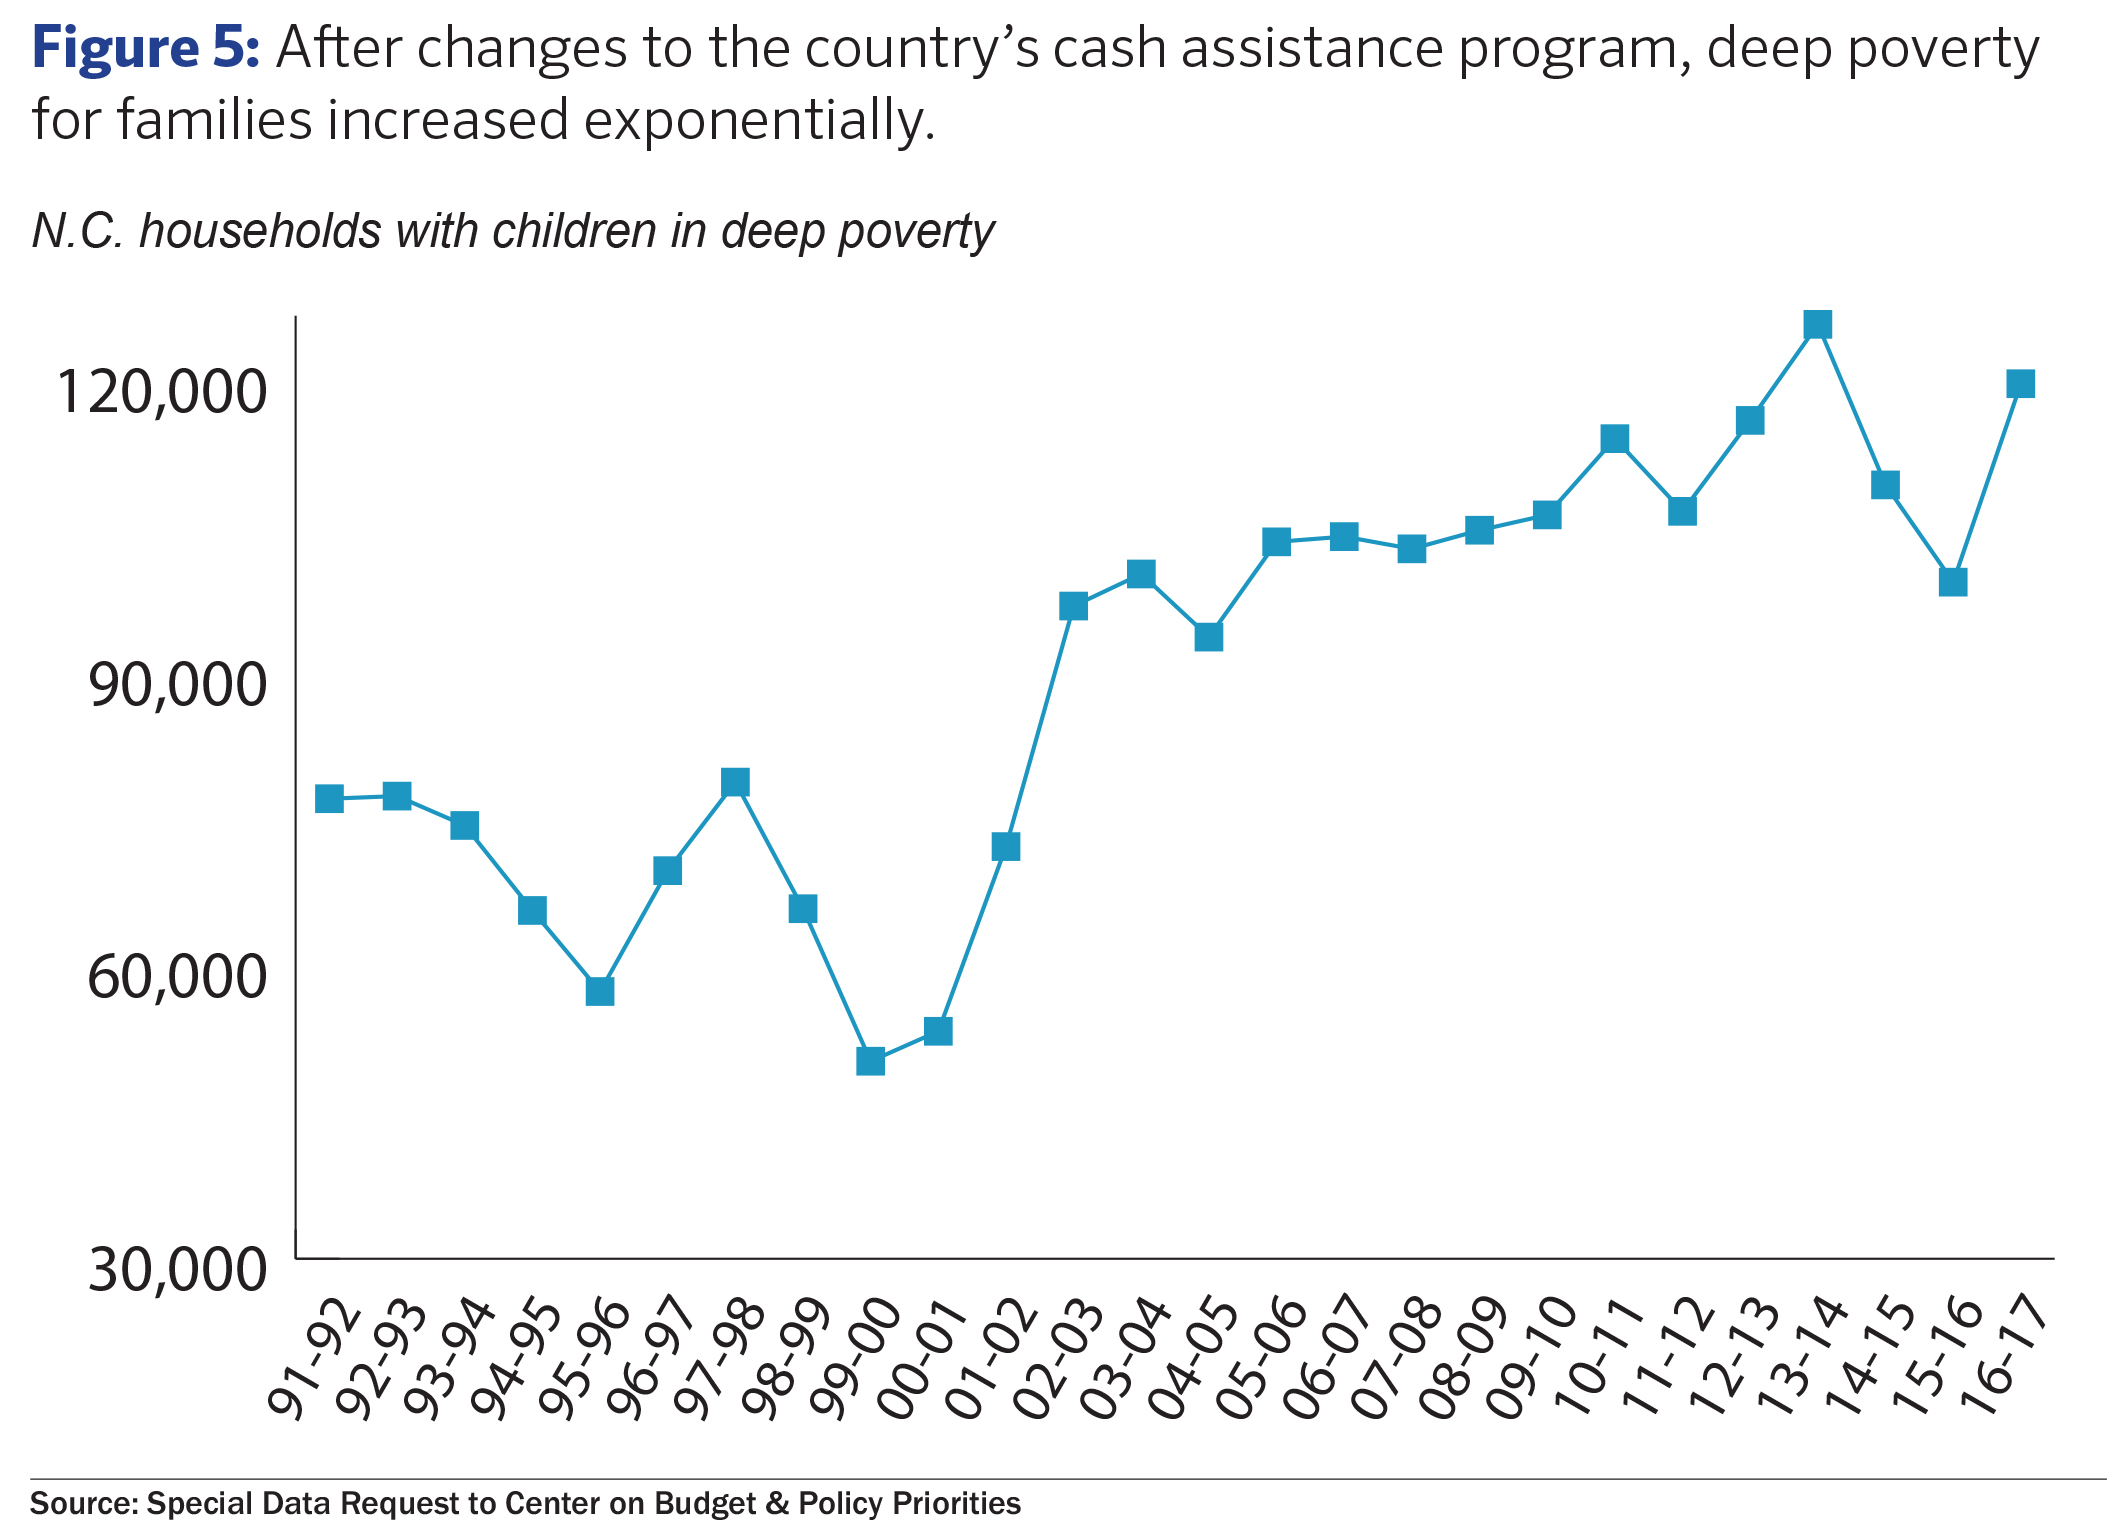
Failing to focus on people struggling to get by and failing to effectively design programs and policies to smooth a pathway out of poverty can make matters worse. This is evident from the harmful effects of the federal changes made to the country’s social safety net in 1996 that rippled throughout the country and North Carolina. These changes have been found to contribute to growing levels of deep poverty where people are living on far less than what it takes to make ends meet without a connection to the supports that could provide a pathway out of poverty.29
The 1996 welfare law replaced Aid to Families with Dependent Children (AFDC), an entitlement program for poor families with children, with Temporary Assistance for Needy Families (TANF), a block grant with fixed annual funding for states. States were able to set the types of services that would be funded and eligibility requirements but across the program time limits and work reporting were established.
Nearly 623,000 North Carolinians lived in deep poverty in 2018, meaning they earned half or less of the annual poverty-level income for their family size.30 This figure is up from the 537,000 people who lived in deep poverty in the state before the Great Recession began.31 But it has increased even more significantly from the level of deep poverty experienced in the state prior to 2000; the number of families with children living in deep poverty has increased by 55 percent since 1990.32
The immediate impacts of welfare reform in 1996 were specifically focused on improved labor force participation and increased income for female-headed households. While these impacts were real, researchers have documented the diminished duration of benefits as the economy has created more low-wage jobs and experienced successive downturns in the 2000s. In the past year, nearly 30 percent of female-headed households in North Carolina lived below the federal poverty line.33
$1 N.C. men
83¢ N.C. women
82.1¢ Asian women
63.5¢ Black women
60.7¢ Native American women
49.6¢ Latinx women
Source: National Women’s Law Center, October 2019
The challenge for women in securing economic well-being is greater than for men, which further contributes to the greater rates of hardship for households headed by women. While women have made tremendous economic strides over the past few decades, they are still more likely than men to live paycheck to paycheck and struggle to pay the bills. Last year, North Carolinian women who worked full-time year-round earned just 83 cents for every dollar that men earned, on average.34 Latina, Native American, African American, and Asian American women in North Carolina make 49.6, 60.7, 63.5, and 82.1 cents for every dollar men earn, respectively.35
The poverty rate for women in the state was 15.3 percent in 2018, compared to 12.7 percent for men.36 Women of color also face particularly high rates of poverty because of the barriers that have been created through policies that haven’t fully valued their economic contributions. These policies include excluding specific industries from minimum wage standards and failing to minimize the economic losses of child rearing and family care, for example. In 2018, Latina, American Indian, and African American women were twice as likely to live in poverty as Asian and white women.37
Relative poverty in a highly unequal state
International research into the relationship between poverty, inequality, and economic growth can inform our understanding of the need for growth in North Carolina and across the United States that is “pro-poor.”38
The effect growth has on reducing income poverty will depend upon the extent to which the pattern of growth enhances the ability of poor people to participate in, contribute to, and benefit from growth. If the pattern of growth is broad based and inclusive with respect to the sectors from which poor women and men earn their livelihoods, the regions in which they live, creates jobs that they may fill, and increases access to productive assets and markets for goods and services they produce, it is likely that their incomes will rise more rapidly and they will be able to acquire the assets they need to continue to increase incomes in the future. If, on the other hand, the poor are stuck in regions and sectors that are marginalised [sic] from the growth process, then very rapid rates of per capita growth will do little to reduce poverty.39
To overcome the inequalities that exist for people living in poverty — in a way that is not just about their absolute level of hardship but their relative economic well-being compared to those at the top of the income distribution — growth must be faster and sustained for longer periods of time. Taking these international lessons to the states provides a helpful reminder that analysis of poverty must consider income inequality by necessity.40
In North Carolina, the richest 5 percent hold 28 times the income of the bottom 20 percent.41 The share of income held by the top 20 percent in 2018 was more than 50 percent, or roughly the same amount of income held by the bottom 60 percent of North Carolinians.42
There is nothing natural about this distribution of income. As researchers have pointed out looking over decades, the rapid growth in income at the top while the bottom faces stagnation or worse real loss in purchasing power has been the result of the combined policy choices that reduced the bargaining power of workers, eroded supports to families from the public sector, and unfettered the accumulation of income and wealth for the already wealthy.43
Just as policy choices have grown income inequality, policy choices that focus on those living in poverty can shrink inequalities.44 Notably, income inequality varies across states, indicating that state and local policies can matter in addressing this barrier to reducing hardship and promoting mobility. Without a focus on reducing inequalities, the broader health of the economy and communities will suffer, as will the fundamental values of our country.
North Carolina could lead Southern neighbors to sound economic footing
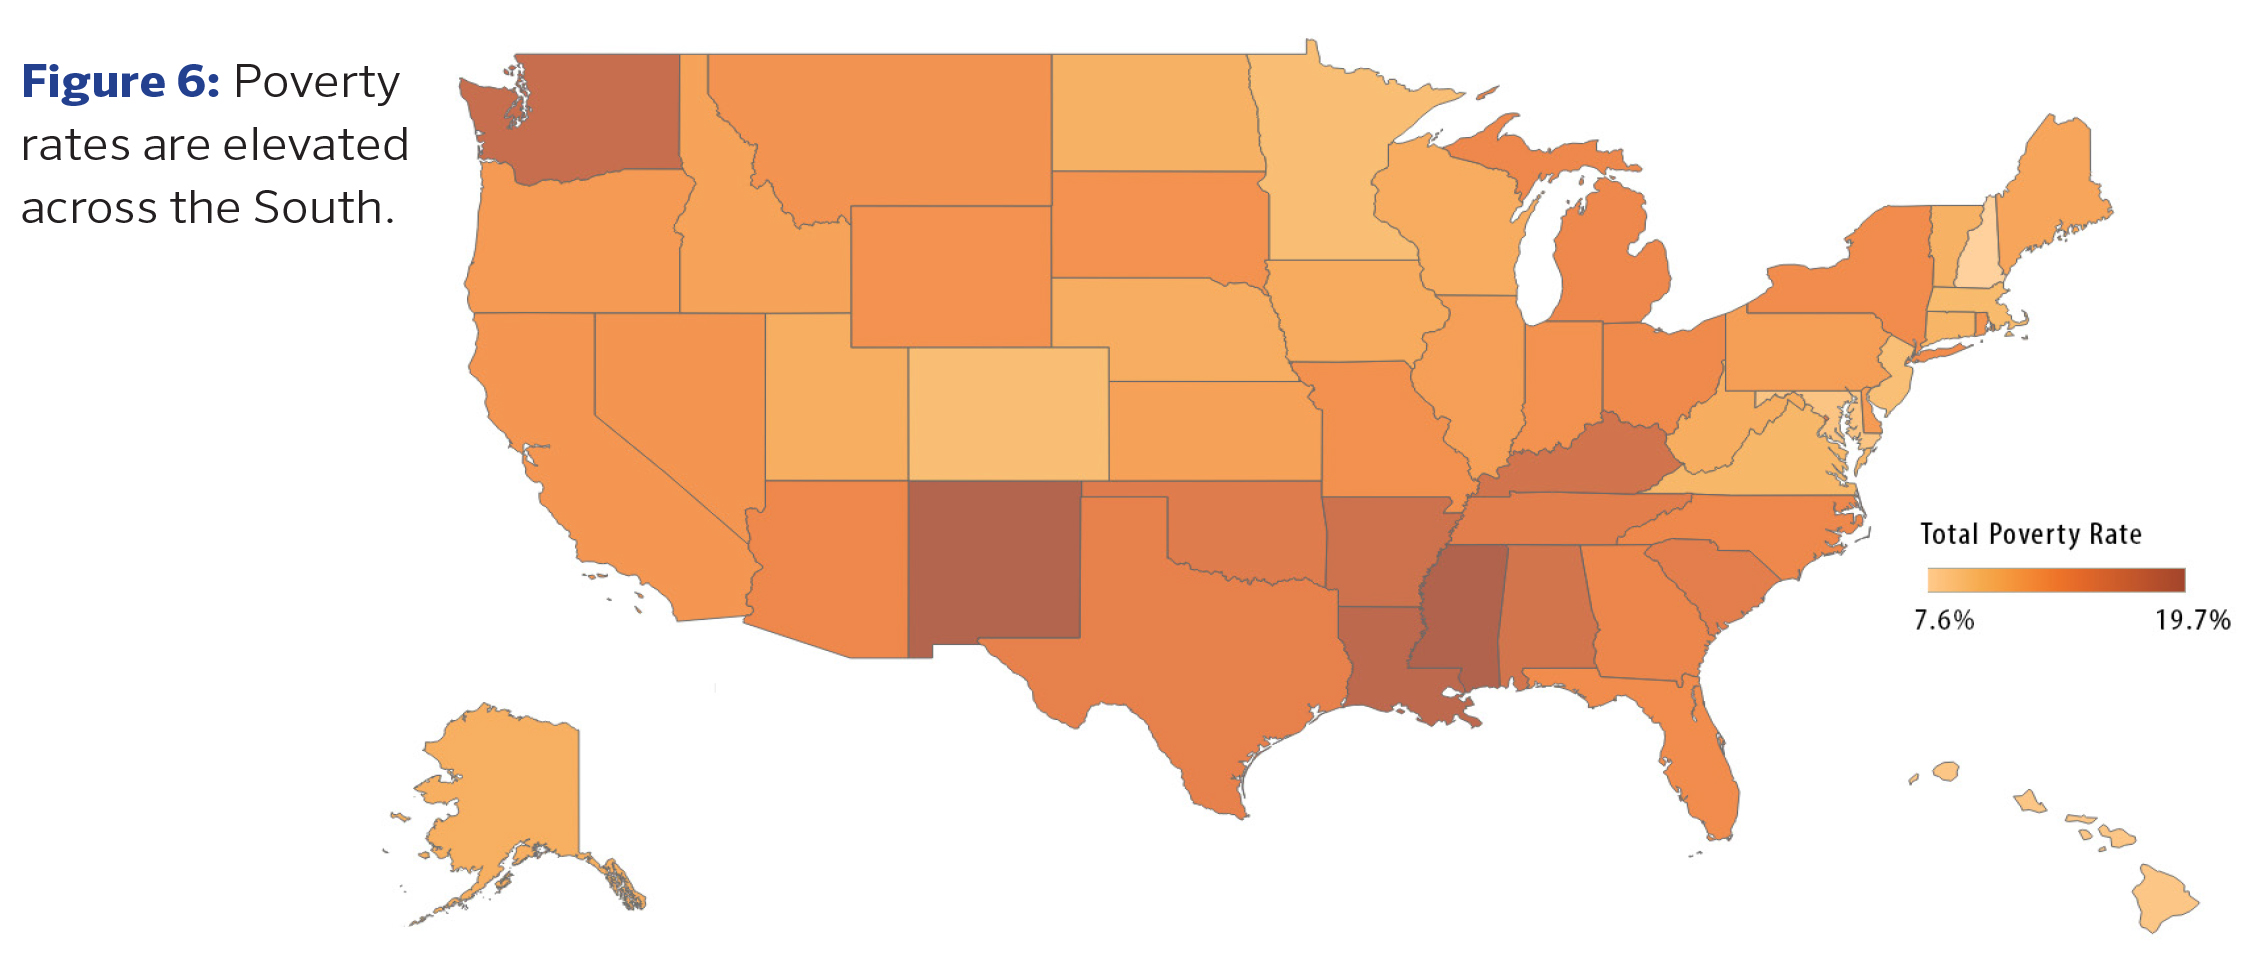
Across a range of measures of economic well-being, North Carolina ranks below the national average and often in the lowest third of states for high levels of hardship and inequality, along with our Southern neighbors. Within the Southern region, North Carolina ranks in the middle of the pack.
At one time, North Carolina leaders envisioned the state could lead the country forward in addressing hardship and advancing more equitable outcomes. The North Carolina Fund aimed to build an infrastructure of opportunity that recognized the material needs of people living on very low incomes and the power that communities needed to advocate for the services and connections to opportunity that would sustain their economic well-being in the long-term and across generations.
Recent data from the American Community Survey suggests that North Carolina leaders are needed who recognize the potential for the state to lead the South toward greater shared prosperity and to develop a renewed focus on hardship to advance the well-being of the state as a whole.
Last year, North Carolina’s poverty rate (14 percent) was lower than South Carolina (15.3 percent) and Georgia (14.9 percent) but higher than Virginia (10.7 percent).
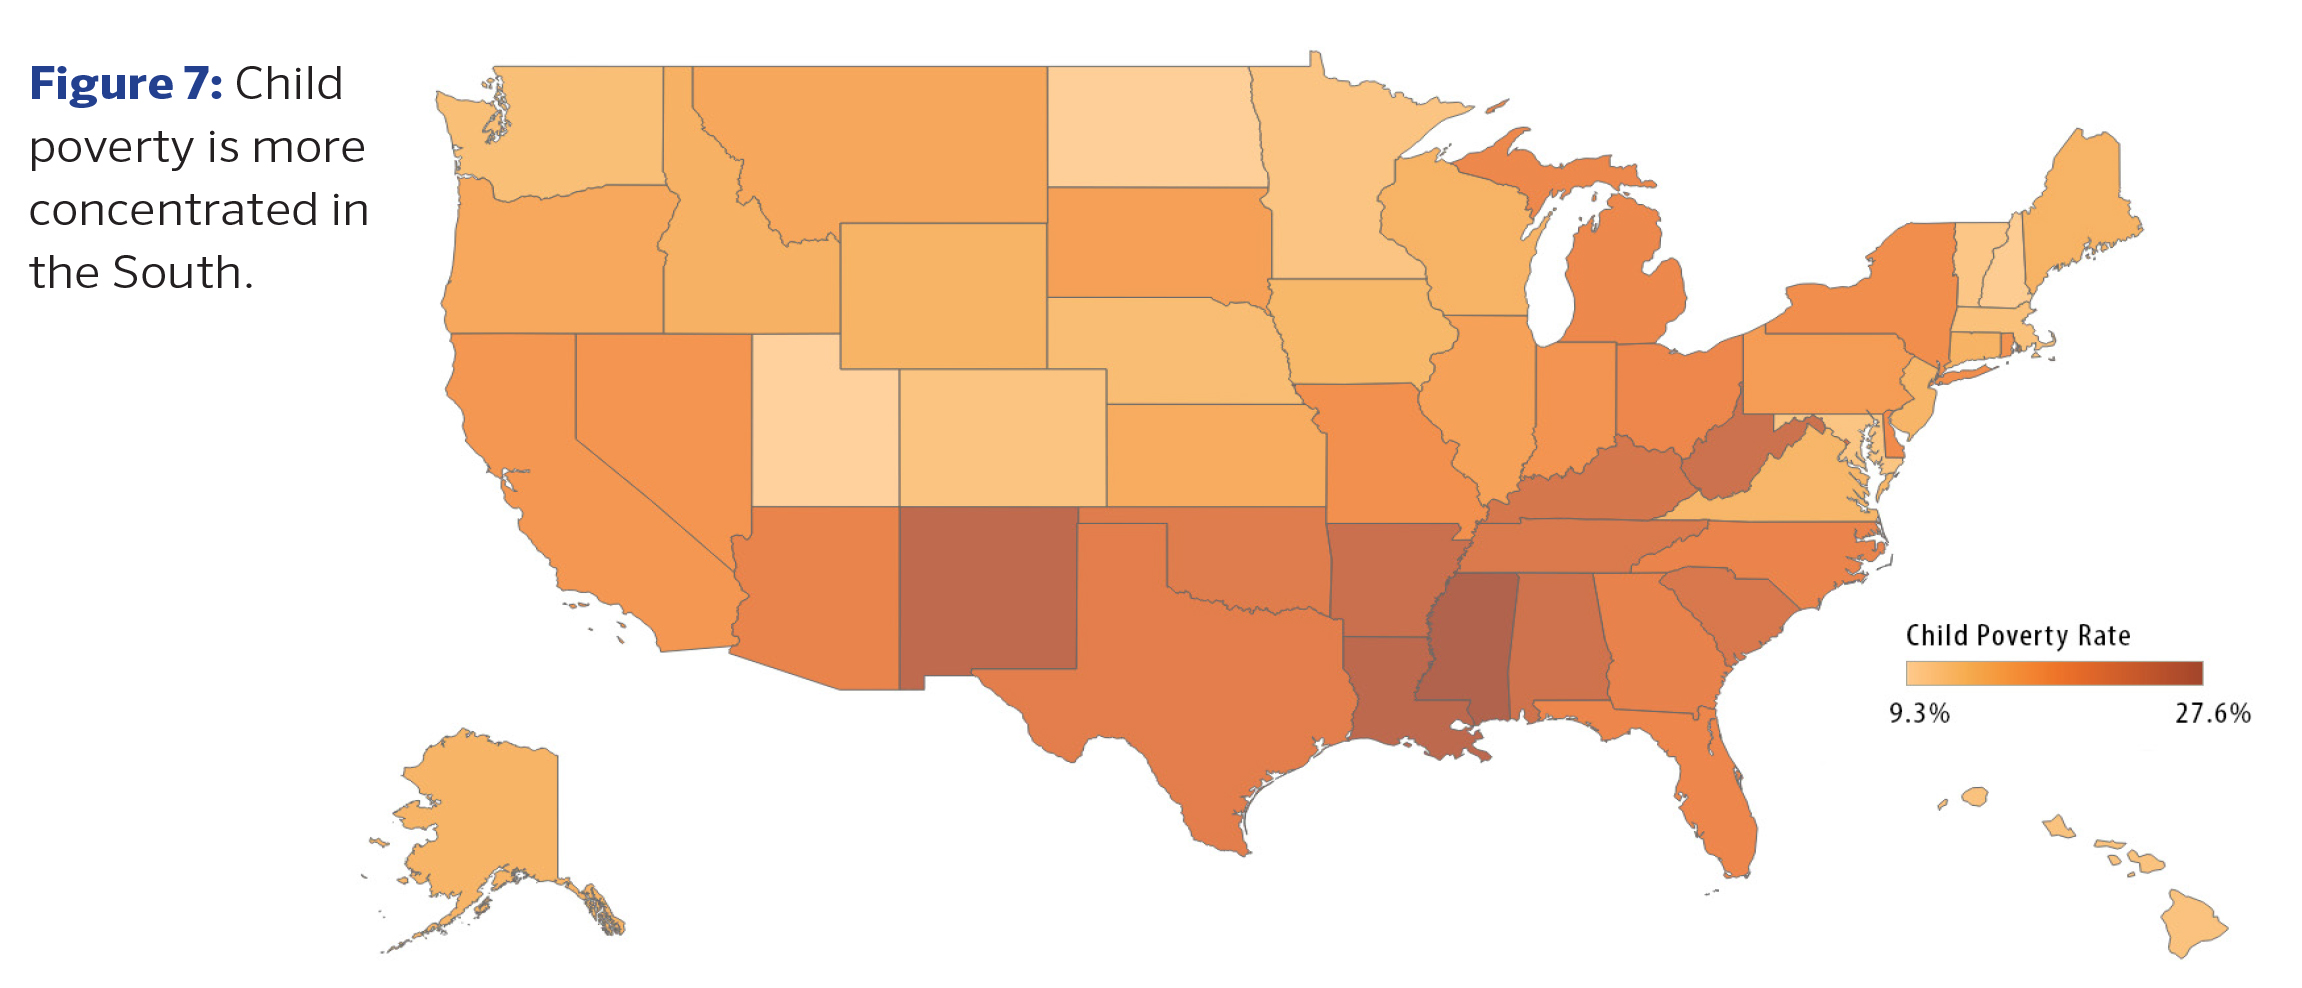
The state’s child poverty rate was the 14th highest in the nation in 2018 (19.7 percent). Compared to bordering states, the rate was higher than Virginia (13.3 percent), but lower than the child poverty rate in Georgia (20.2 percent), South Carolina (22.4 percent), and Tennessee (22.1 percent).
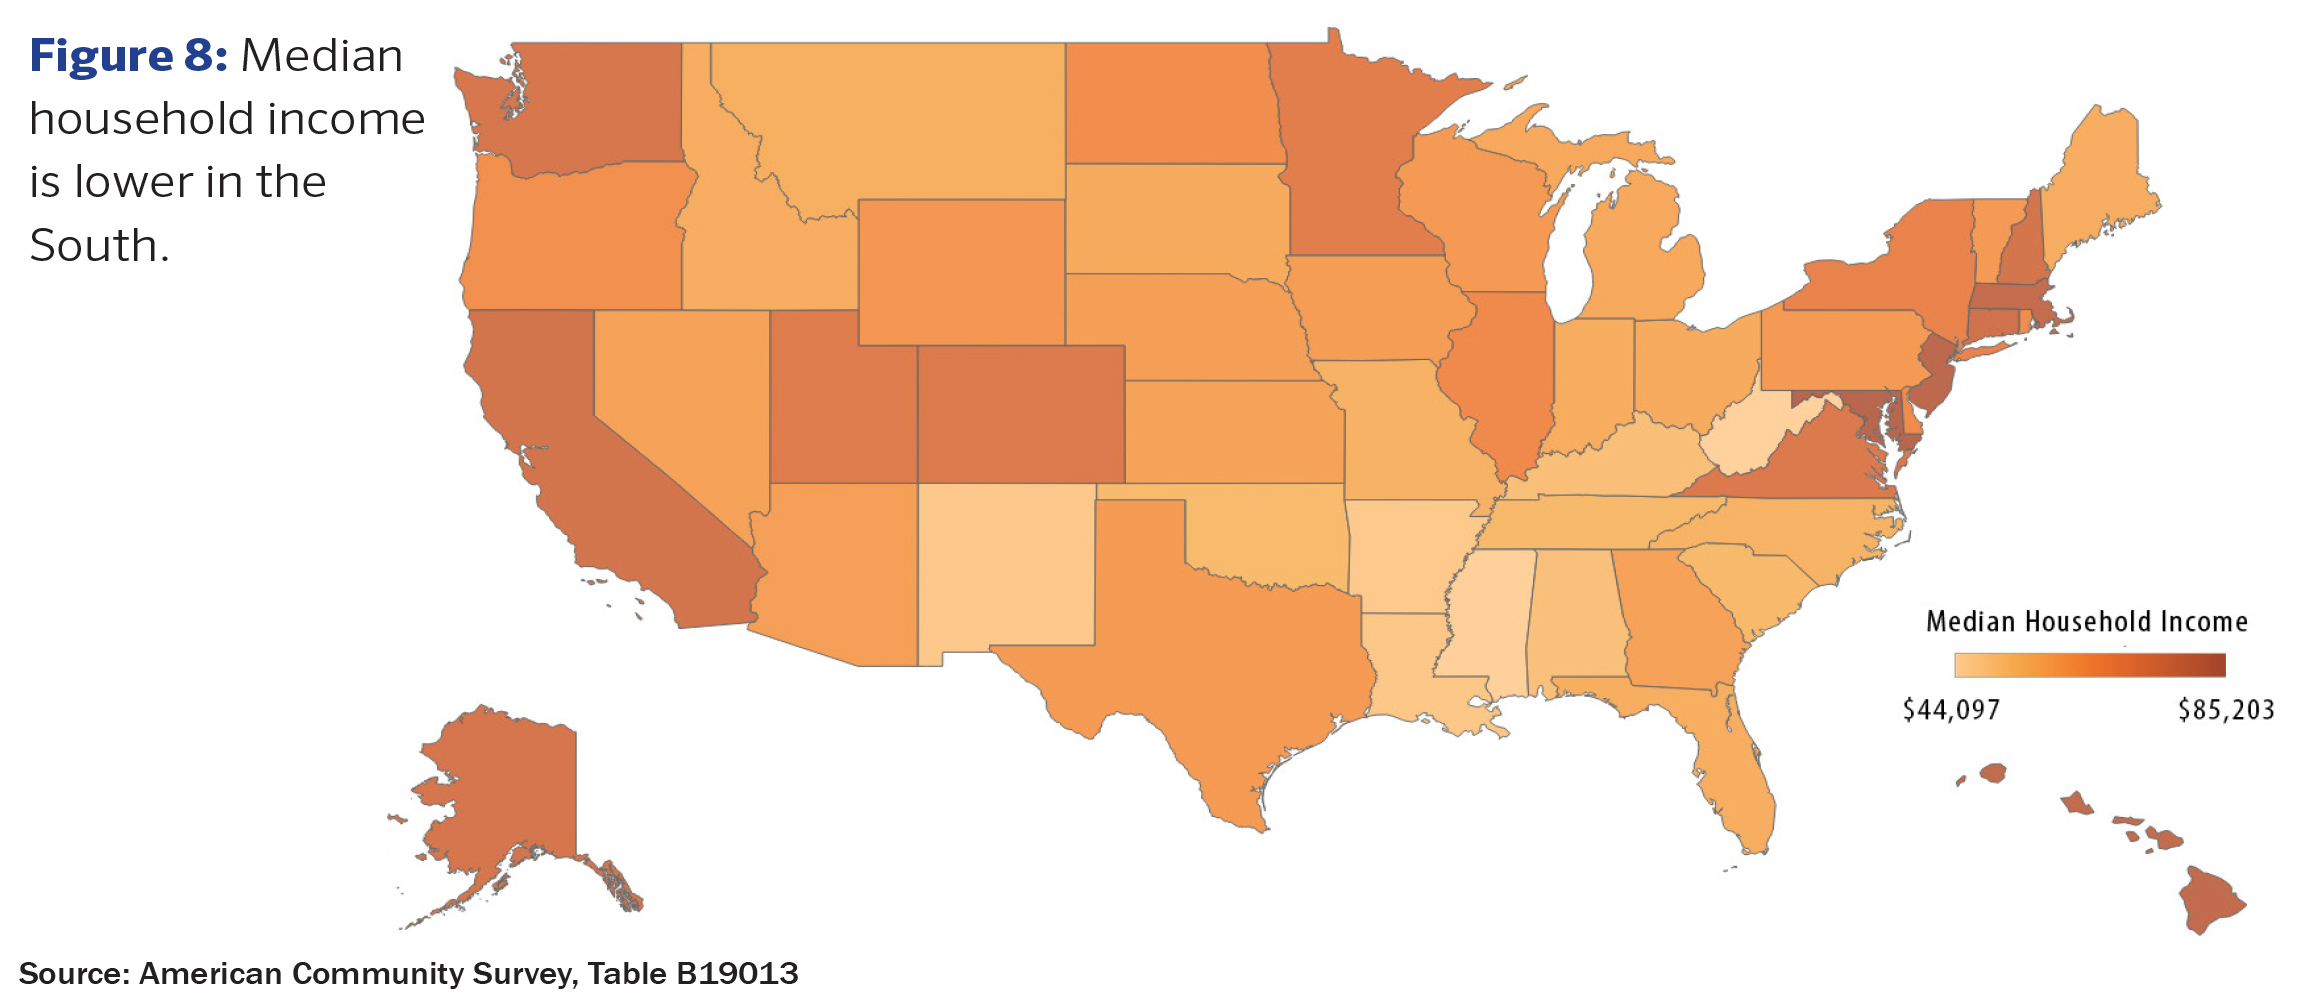
Given these numbers on hardship, it is not surprising to find that median household income is lower in the South than in regions across the country. North Carolina’s median household income of $53,855 is only slightly higher than median household income in South Carolina ($52,306) and Tennessee ($52,375).
The drivers of the South’s higher levels of poverty and lower levels of median household income were not generated by the events of the past year alone. As researchers have found, the South’s higher rates of poverty are tied to the region’s history of uncompensated labor through slavery, the persistence of low wages and low unionization rates, and lower levels of public investment in the common good.45
To drive better economic outcomes in the South, policies are needed that tear down the barriers of this history and halt the continued pursuit of low regulation, low investment, and low wages as the pathway to growth. The evidence is clear that this pathway delivers persistent hardship.
Growing up in poverty blocks economic mobility for many N.C. children
Despite the essential role that economic mobility plays in a well-functioning economy46, in North Carolina, more so than most other states, it is exceptionally difficult for children who are born into families with low incomes to one day enjoy economic success of their own.47 Parental economic status and zip code — not hard work or education level — is more often than not the factor that best predicts what level of income a child will have.48 Addressing poverty is one of the best ways to ensure that North Carolinians who work hard are able to succeed and experience economic freedom.
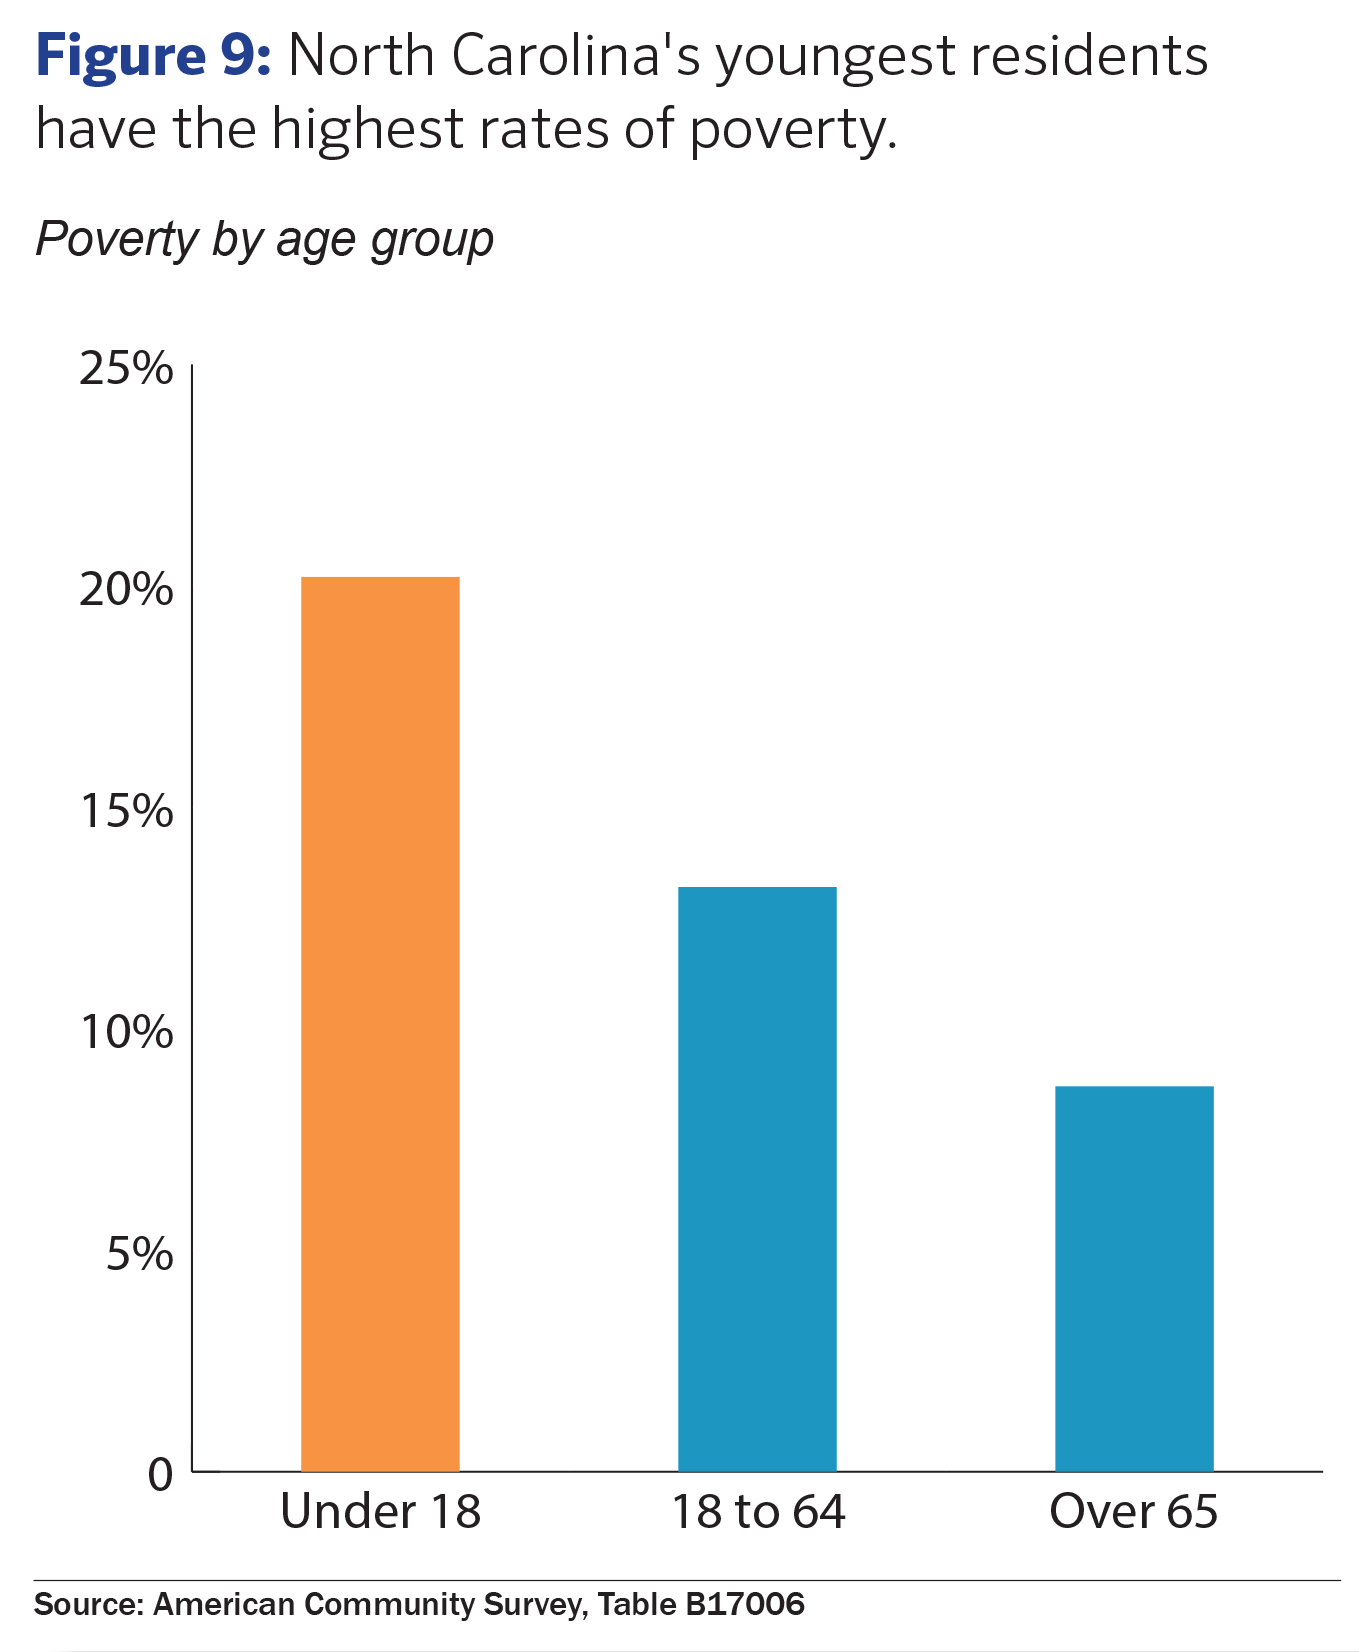
In 2018, North Carolina’s child poverty rate was 20.2 percent, above the rate for 18-to 64-year-olds and more than two times the rate for North Carolinians over 65 (See Figure 9).
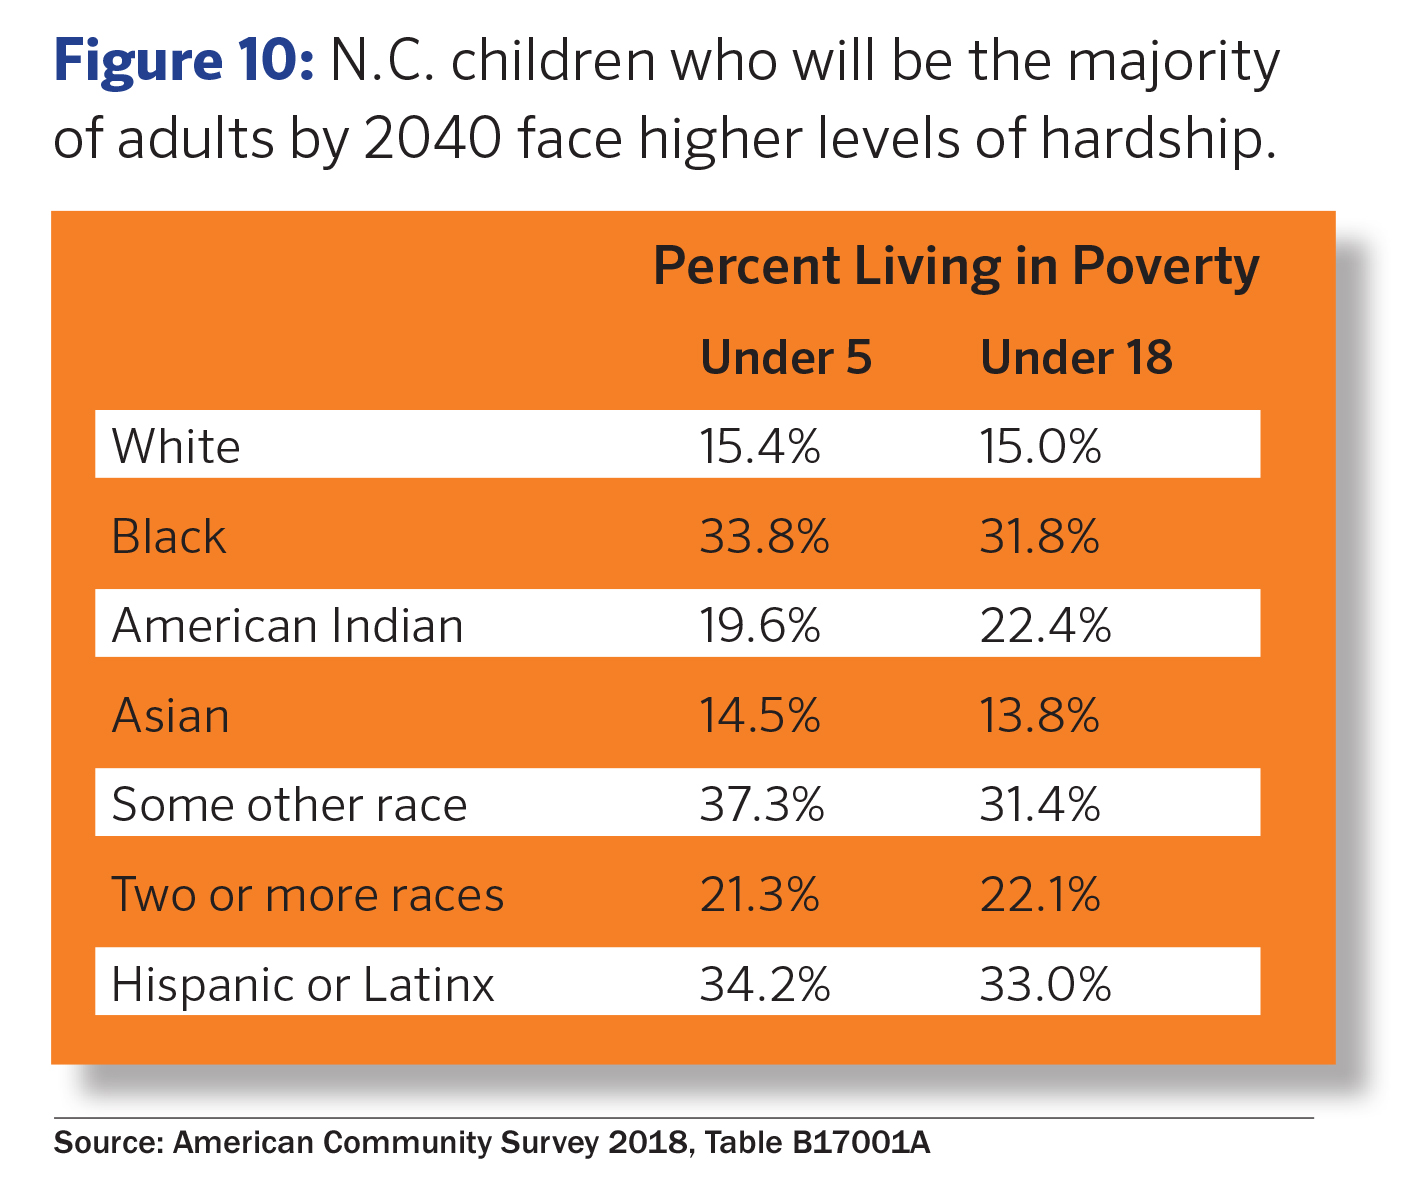
While a staggering 1 in 5 children lived in poverty last year, children of color who will be the majority of the state’s adult population in 2040 experienced higher levels of poverty than just about any demographic in the state.
As North Carolina considers how best to position the state for success in the future, the fundamental work of ensuring that children and, particularly, children of color today don’t experience the harmful effects of poverty is critical. Failure to remove barriers to economic mobility will “constrain productivity and curb economic growth”49 but also will generate a host of higher costs and a lower quality of life for individuals and entire communities.
As researchers have documented,50 the boosts to local economies from ensuring that childhoods are not mired by poverty are quantifiable and significant enough to transform the landscape of opportunities for all people in a community.
Supports to intergenerational economic mobility require more than education
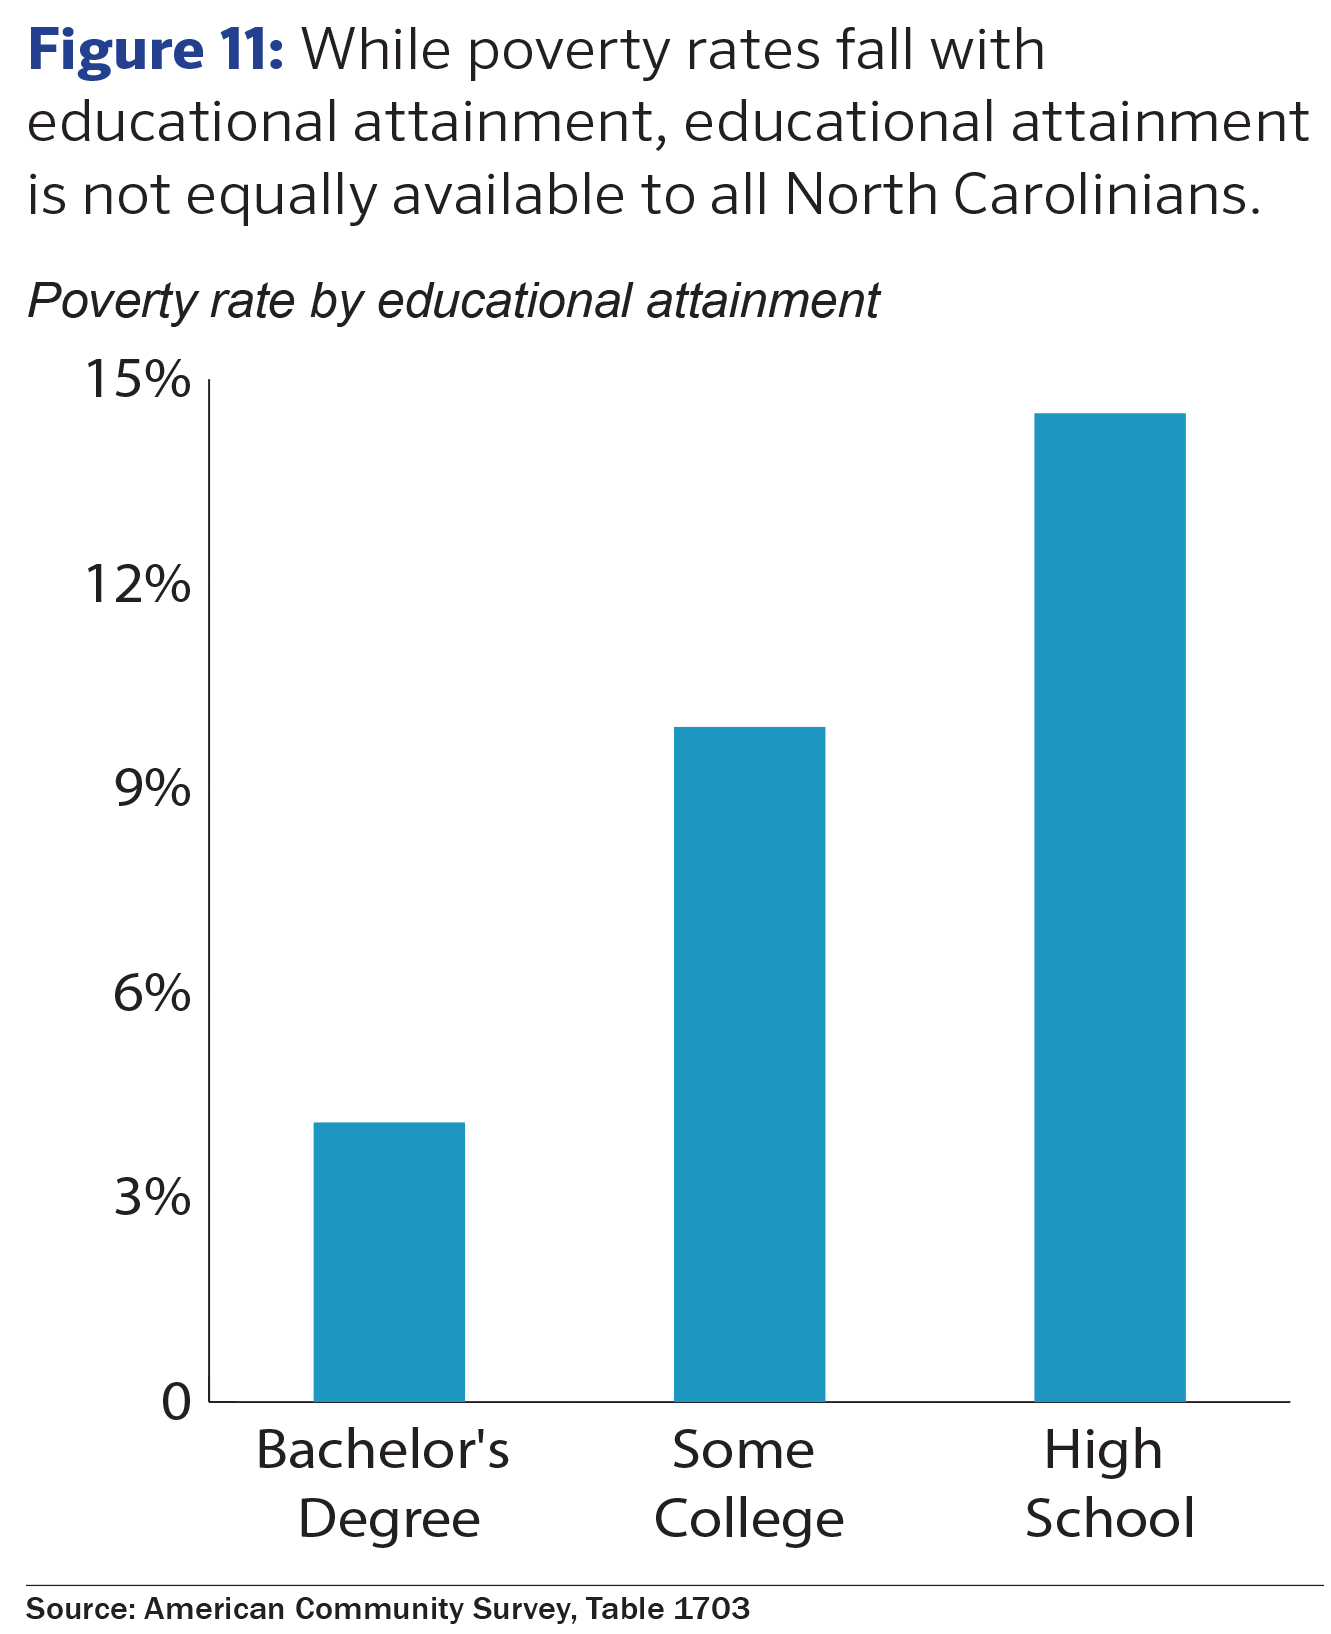
North Carolinians have long been told that the pathway out of poverty goes through the schoolhouse door. The latest poverty data continues to demonstrate that at higher levels of educational attainment, North Carolinians are less likely to experience poverty on average (See Figure 7). Yet, given the identified need to increase attainment rates overall and the reality that barriers to completion exist for students with low incomes and students of color, education isn’t a guarantee in the effort to break poverty from reaching across generations.
Instead, a focus on only education to address poverty could hold in place different economic
outcomes, as researchers have increasingly found in assessing income and wealth distribution. For example, in 2018, 22 percent of white Americans held a Bachelor’s degree while 16 percent of Black Americans and 13.1 percent of Latinx Americans did.51 The Working Poor Families Project in 2015 found that 19 percent of people of color aged 18 to 65 in the state did not have a high school diploma while 8.2 percent of white people did not.52
When people struggle with economic hardship, communities and economies suffer
Where people live drives health, education, and employment outcomes. The places where people are living in poverty are not randomly distributed across the state. Instead, some places experience concentrations of poverty, persistence of poverty, or rapid growth in poverty, which creates a host of impacts more broadly on the community and region. These spatial trends can be traced concretely to policy and investment decisions. Where jobs are opening and whether housing is affordable, where industries are declining or businesses are expanding, and how families are supported and connected by institutions and social networks are all drivers of where people live, and they particularly effect people living with low incomes.
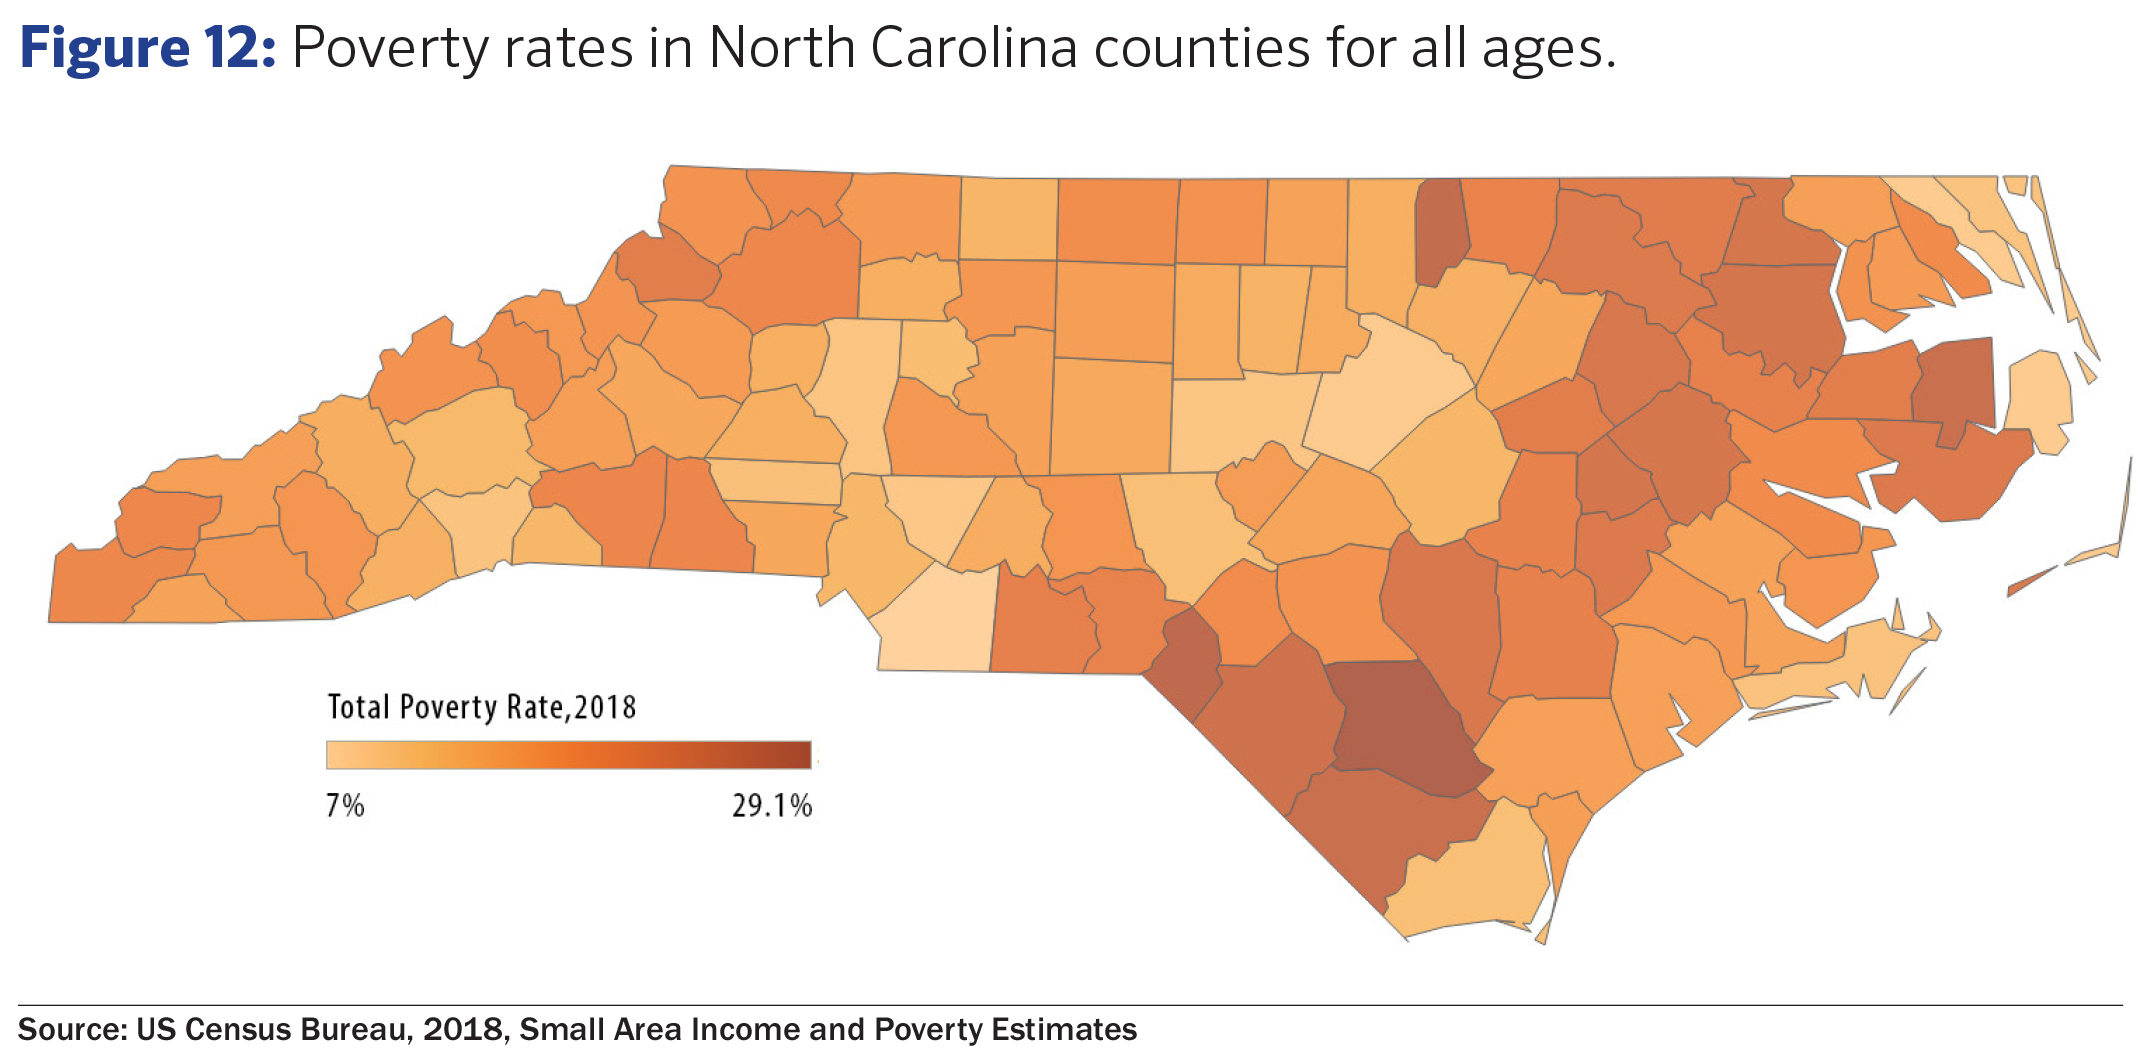
In North Carolina, the historic legacy of the state’s slave economy and industrialization are imprinted on the landscape of opportunity in the state even today. In 2018, poverty’s reach varied considerably across North Carolina’s counties with rates ranging from 7 percent in Union County to 29 percent in Bladen County. Sixty-eight counties had poverty rates higher than the state average in 2018 (See Figure 8). Twenty three counties had poverty rates above 20 percent, a recognized threshold in the level of hardship for people that extends more broadly to barriers of opportunity at the community level that are experienced by all people.53
The persistence of high levels of poverty in certain regions of North Carolina over three or more decades was last officially calculated in 2010, when 10 counties in North Carolina achieved that threshold. These counties were all rural and located in the Eastern region of the state.54 Looking at data from 2000 to 2018 suggests that five of those ten counties could enter their fourth decade of having poverty rates above 20 percent.55 While urban and suburban counties may appear to be experiencing lower poverty rates on average and are experiencing the greatest concentration of job growth, these same communities have some of the highest concentrations of poverty and the greatest growth in the number of people in neighborhoods of high poverty in the state.56 These concentrations of poverty exclude people from the benefits of growth happening in their broader community and create barriers to full realization of the gains possible with employment and population growth.
Public policies can minimize poverty, sustain economic well-being
Beyond measuring the reality of hardship in our state, the American Community Survey provides important information about the role of public policies in minimizing poverty. By developing a supplemental poverty measure for each state, researchers are able to quantify the number of people lifted out of poverty as a result of programs like Social Security, unemployment insurance, and the Earned Income Tax Credit.
A look at the states where the supplemental poverty measure is lower than the poverty rate finds that North Carolina ranks 18th in terms of the reduction of the number of people living in poverty after taking into account public programs.57 Nationally, the most significant antipoverty policies continued to be Social Security, refundable tax credits, and food assistance.58
Given the importance of these programs and the remaining challenge for North Carolina in reducing hardship, our state needs a recommitment to public policies that minimize the harm of poverty and a consideration of a broader set of strategies that promote the well-being that each person deserves.
Such a broader set of strategies should consider the role of assets and wealth in building long-term opportunities for sustainable exit from poverty, the design of our public programs to improve alignment and sustained support to self-sufficiency, as well as the fundamental need for a cash assistance program that recognizes the necessity for families to have the income needed to make the right choices for their family.59
Footnotes
- American Community Survey, Table B17001
- American Community Survey, Table B19081
- American Community Survey, Table B19082
- American Community Survey, Table B17001
- American Community Survey, Table B17001
- Kennedy II, Brian. 2019 Living Income Standard for All 100 Counties. NC Justice Center: Raleigh, NC.
- Mishel, Lawrence, Bivens, Josh, and Shierholz Gould, Elise Heidi. State of Working America 2019, 12th Edition. 12th ed. Economic Policy Institute. http://stateofworkingamerica.org/subjects/overview/?reader and Bivens, Josh. 2016. “Why Is Recovery Taking so Long—and Who’s to Blame?” Economic Policy Institute. https://www.epi.org/publication/why-is-recovery-taking-so-long-and-who-is-to-blame/
- McKernan, Signe-Mary, Caroline Ratcliffe and Stephanie R. Cellini, September 2009. Transitioning In and Out of Poverty. The Urban Institute. https://www.urban.org/sites/default/files/publication/30636/411956-Transitioning-In-and-Out-of-Poverty.PDF
- American Community Survey, Table B17002
- Bradley L. Hardy. 2016. “Addressing Income Volatility in the United States: Flexible Policy Solutions for Changing Economic Circumstances.” https://equitablegrowth.org/addressing-income-volatility-in-the-united-states-flexible-policy-solutions-for-changing-economic-circumstances/ and “Addressing Income Volatility in the United States: Flexible Policy Solutions for Changing Economic Circumstances.” 2016. Equitable Growth. https://equitablegrowth.org/addressing-income-volatility-in-the-united-states-flexible-policy-solutions-for-changing-economic-circumstances/
- DeNavas-Walt, Carmen, Bernadette D. Proctor and Jessica C. Smith, September 2011. Income, Poverty and Health Insurance Coverage in the United States: 2010. U.S. Census Bureau. https://www.census.gov/prod/2011pubs/p60-239.pdf
- McKernan et al, September 2009.
- McCarty A. T. (2016). Child Poverty in the United States: A Tale of Devastation and the Promise of Hope. Sociology compass, 10(7), 623–639. doi:10.1111/soc4.12386https://www.ncbi.nlm.nih.gov/pmc/articles/PMC5589198//
- Danziger, Sheldon, Koji Chavez and Erin Cumberworth. October 2012. Poverty and the Great Recession. The Russell Sage Foundation and the Stanford Center on Poverty and Inequality. https://inequality.stanford.edu/sites/default/files/Poverty_fact_sheet.pdf
- American Community Survey, Table B17001
- Brown, Desmond. 2011. “10 Reasons Why Cutting Poverty Is Good for Our Nation.” Center for American Progress Action. https://www.
americanprogressaction.org/issues/poverty/news/2011/12/06/10771/10-reasons-why-cutting-poverty-is-good-for-our-nation/ - Taggart, Robert, 1982. The Hardship Problem of Labor Markets and Pavetti, LaDonna. April 2018. Evidence Doesn’t Support Claims of Success of TANF Work Requirements. Center on Budget & Policy Priorities. https://www.cbpp.org/research/family-income-support/evidence-doesnt-support-claims-of-success-of-tanf-work-requirements
- Harold Meyerson. 2015. “How the American South Drives the Low-Wage Economy – The American Prospect.” https://prospect.org/labor/american-south-drives-low-wage-economy/ and Working Poor Families Project, Conditions of Low-Income Families in the States, All Tables
- Working Poor Families Project, Conditions of Low-Income Families in the States, Table 1A1b
- Working Poor Families Project, Conditions of Low-Income Families in the States, Table 1A2b
- American Community Survey, 2018, Table S1703
- American Community Survey, 2018, Table B19013
- Wimer, Christopher, Sophie Collyer, and Xavier Jaravel. “The Cost of Being Poor: Inflation Inequality leads to three million more people living in poverty.” Groundwork Collaborative and the Center on Poverty and Social Policy at Columbia University: 13. https://groundworkcollaborative.org/wp-content/uploads/2019/11/The-Costs-of-Being-Poor-Groundwork-Collaborative.pdf
- Fellowes, Matt. 2001. “From Poverty, Opportunity: Putting the Market to Work for Lower Income Families.” Brookings Institution https://www.brookings.edu/research/from-poverty-opportunity-putting-the-market-to-work-for-lower-income-families/
- Duncan, Greg J. and Katherine Magnuson, Winter 2011. The Long Reach of Poverty. Pathways, Stanford University.
- Cooper, Kerris, and Kitty Stewart. “Does Money Affect Children’s Outcomes? An Update.” : 41. http://sticerd.lse.ac.uk/dps/case/cp/
casepaper203.pdf Xu, Q., Potvin, L., Zunzunegui, M. V., & Frohlich, K. L. (2003). Effects of low income on infant health. CMAJ : Canadian Medical
Association journal = journal de l’Association medicale canadienne, 168(12), 1533–1538. - Chetty, R., Stepner, M., Abraham, S., Lin, S., Scuderi, B., Turner, N., … Cutler, D. (2016). The Association Between Income and Life Expectancy
in the United States, 2001-2014. JAMA, 315(16), 1750–1766. doi:10.1001/jama.2016.4226 - Marmot, Michael. 2002. “The Influence Of Income On Health: Views Of An Epidemiologist.” Health Affairs 21(2): 31–46. https://www.
healthaffairs.org/doi/full/10.1377/hlthaff.21.2.31 - Kennedy II, Brian. April 2018. Going Backwards: A growth in concentrated poverty signals increasing levels of economic and racial
segregation. NC Justice Center. https://www.ncjustice.org/wp-content/uploads/2018/12/BTC-BRIEF-Concentrated-Poverty_FINAL.pdf - American Community Survey, Table B17002
- American Community Survey, 2008, Table B17002
- Floyd, Ife, Burnside, Ashley, and Schott, Liz. 2015. TANF Reaching Few Poor Families. https://www.cbpp.org/research/family-incomesupport/
tanf-reaching-few-poor-families - American Community Survey, 2018, Table S1703
- National Women’s Law Center, October 2019. “The Wage Gap by State for Women Overall 2018.” Based on 2018 American Survey data.
Available here: https://nwlc.org/resources/wage-gap-state-state/ - National Women’s Law Center, October 2019.
- American Community Survey, 2018, Table S1703
- “Women and Poverty, State by State.” NWLC. https://nwlc.org/resources/women-and-poverty-state-by-state/
- OECD (2007), Promoting Pro-Poor Growth: Policy Guidance for Donors, DAC Guidelines and Reference Series, OECD Publishing, Paris, https://doi.org/10.1787/9789264024786-en.
- OECD, 2007
- UNDP, Income Inequality and the Condition of Chronic Poverty, Chapter 6. https://www.undp.org/content/dam/undp/library/Poverty%20Reduction/Inclusive%20development/Towards%20Human%20Resilience/Towards_SustainingMDGProgress_Ch6.pdf
- American Community Survey, 2018, Table B19081
- McHugh, Patrick, The Top 20 Percent Took Home 51 Percent of all Income in 2018. Prosperity Watch, NC Justice Center. https://www.ncjustice.org/publications/top-20-took-home-51-of-all-income-in-2018-in-n-c/
- State of Working America
- Omi, Michael, Stephen Menendian, and powell, john a. Responding to Rising Inequality: Policy Interventions to Ensure Opportunity for All. Haas Institute. https://belonging.berkeley.edu/sites/default/files/HaasInstitute_InequalityPolicyBrief_FINALforDISTRO_2.pdf
- https://www.facingsouth.org/2018/07/southern-poverty-gets-united-nations-attention, https://www.usnews.com/news/blogs/data-mine/2014/09/18/whats-wrong-with-the-south
- Reeves, R. V. (2016, July 28). The Economic Case for Social Mobility. Brookings Institution. Retrieved from https://www.brookings.edu/opinions/the-economic-case-for-social-mobility/
- Chetty, R., Friedman, J. N., Hendren, N., Jones, M. R., & Porter, S. R. (2018). The Opportunity Atlas: Mapping the Childhood Roots of Social Mobility (No. w25147). National Bureau of Economic Research.; US Department of Housing and Urban Development. Economic Mobility: Measuring the American Dream. Office of Policy Development and Research. Retrieved from https://www.huduser.gov/portal/pdredge/pdr_edge_featd_article_071414.html and Tucker, Whitney, January 2019. Child Poverty in North Carolina: Economic Mobility, NC Child. Retrieved from https://www.ncchild.org/wp-content/uploads/2019/01/1.17.19_E4C_FactSheet_ChildPoverty2.pdf
- Isaacs, J. B. (2007, November 13). Economic Mobility of Families Across Generations. Retrieved from https://www.brookings.edu/research/economic-mobility-of-families-across-generations/. And Chetty et al, 2018.
- OECD. 2010. Going for Growth, Chapter 5, A Family Affair: Intergenerational Social Mobility Across OECD Countries. http://www.oecd.org/
economy/obstaclestosocialmobilityweakenequalopportunitiesandeconomicgrowthsaysoecdstudy.htm - Chetty, Raj, Nathaniel Hendren and Lawrence F. Katz. August 2015. The Effects of Exposure to Better Neighborhoods on Children: New
Evidence from the Moving to Opportunity Experiment and Sirota, Alexandra Forter, March 2019. Reducing the harmful effects of poverty on
children would boost earnings in communities statewide. NC Justice Center. https://www.ncjustice.org/publications/reducing-the-harmful-effectsof-
poverty-on-children-would-boost-earnings-in-communities-statewide/ - American Community Survey, Table 3, https://www.census.gov/data/tables/2018/demo/education-attainment/cps-detailed-tables.html
- Working Poor Families Project, Education and Skills Status of Adults Table.
- Analysis of SAIPE, 2017, American Community Survey
- Sirota, Alexandra. “The Legacy of Hardship: Persistent Poverty in North Carolina.” Budget & Tax Center. January 2012. Available
here: http://www.ncpolicywatch.com/wp-content/uploads/2012/01/BTC-Brief-Persistent-Poverty.pdf - US Census Bureau, 2017, 2010, 2000. SAIPE
- Kennedy II, Brian. April 2018. Going Backwards: A growth in concentrated poverty signals increasing levels of economic and racial segregation. NC Justice Center. https://www.ncjustice.org/wp-content/uploads/2018/12/BTC-BRIEF-Concentrated-Poverty_FINAL.pdf
- US Census Bureau, Supplemental Poverty Measure, 2018. Table A-5
- US Census Bureau, 2017. Figure 8. Change in Number of People in Poverty After Including Each Element. https://www.census.gov/
content/dam/Census/library/visualizations/2018/demo/p60-265/figure8.pdf - Hardy, Bradley L. 2016.