 Endowment
RALEIGH (Dec. 10, 2019) – December 2019 marks the last month of the decade. As you consider stories that seek to summarize the trends and moments of the past decade and how North Carolina is poised to enter the next decade, we wanted to provide a few story ideas and data analysis to support your stories.
The 2010s left far too many North Carolinians behind. A lucky few at the top of the economic heap collected enormous riches, but most working families didn’t get ahead. The headline unemployment rate gives the impression of a full recovery from the Great Recession, but the 2010s were actually a lost decade where we made little or no progress in solving North Carolina’s real economic challenges. At the same time, tax cuts for wealthy individuals and big corporations have undermined our ability to build for the future. We have pulled back from investing in the foundations of a healthy economy and a whole generation of school children have only known a public education system undercut by austerity policies.
This memo documents several key stories from the past decade, including:
- Weak job growth
- Unresolved economic challenges
- Disinvestment in our economic future
- Underfunded public education
Each of these important issues are supported below with data on the past decade. Where possible, we also document how the experience of the 2010s compares to previous decades. We also have produced a great deal of additional analysis and can provide more context and evidence to flesh out the stories addressed here.
The Budget & Tax Center staff are also available to talk on background or on the record on these topics. You can reach Mel Umbarger, Senior Communications Specialist, at mel@ncjustice.org to set up a conversation.
1. Job growth since 2010 has been weak
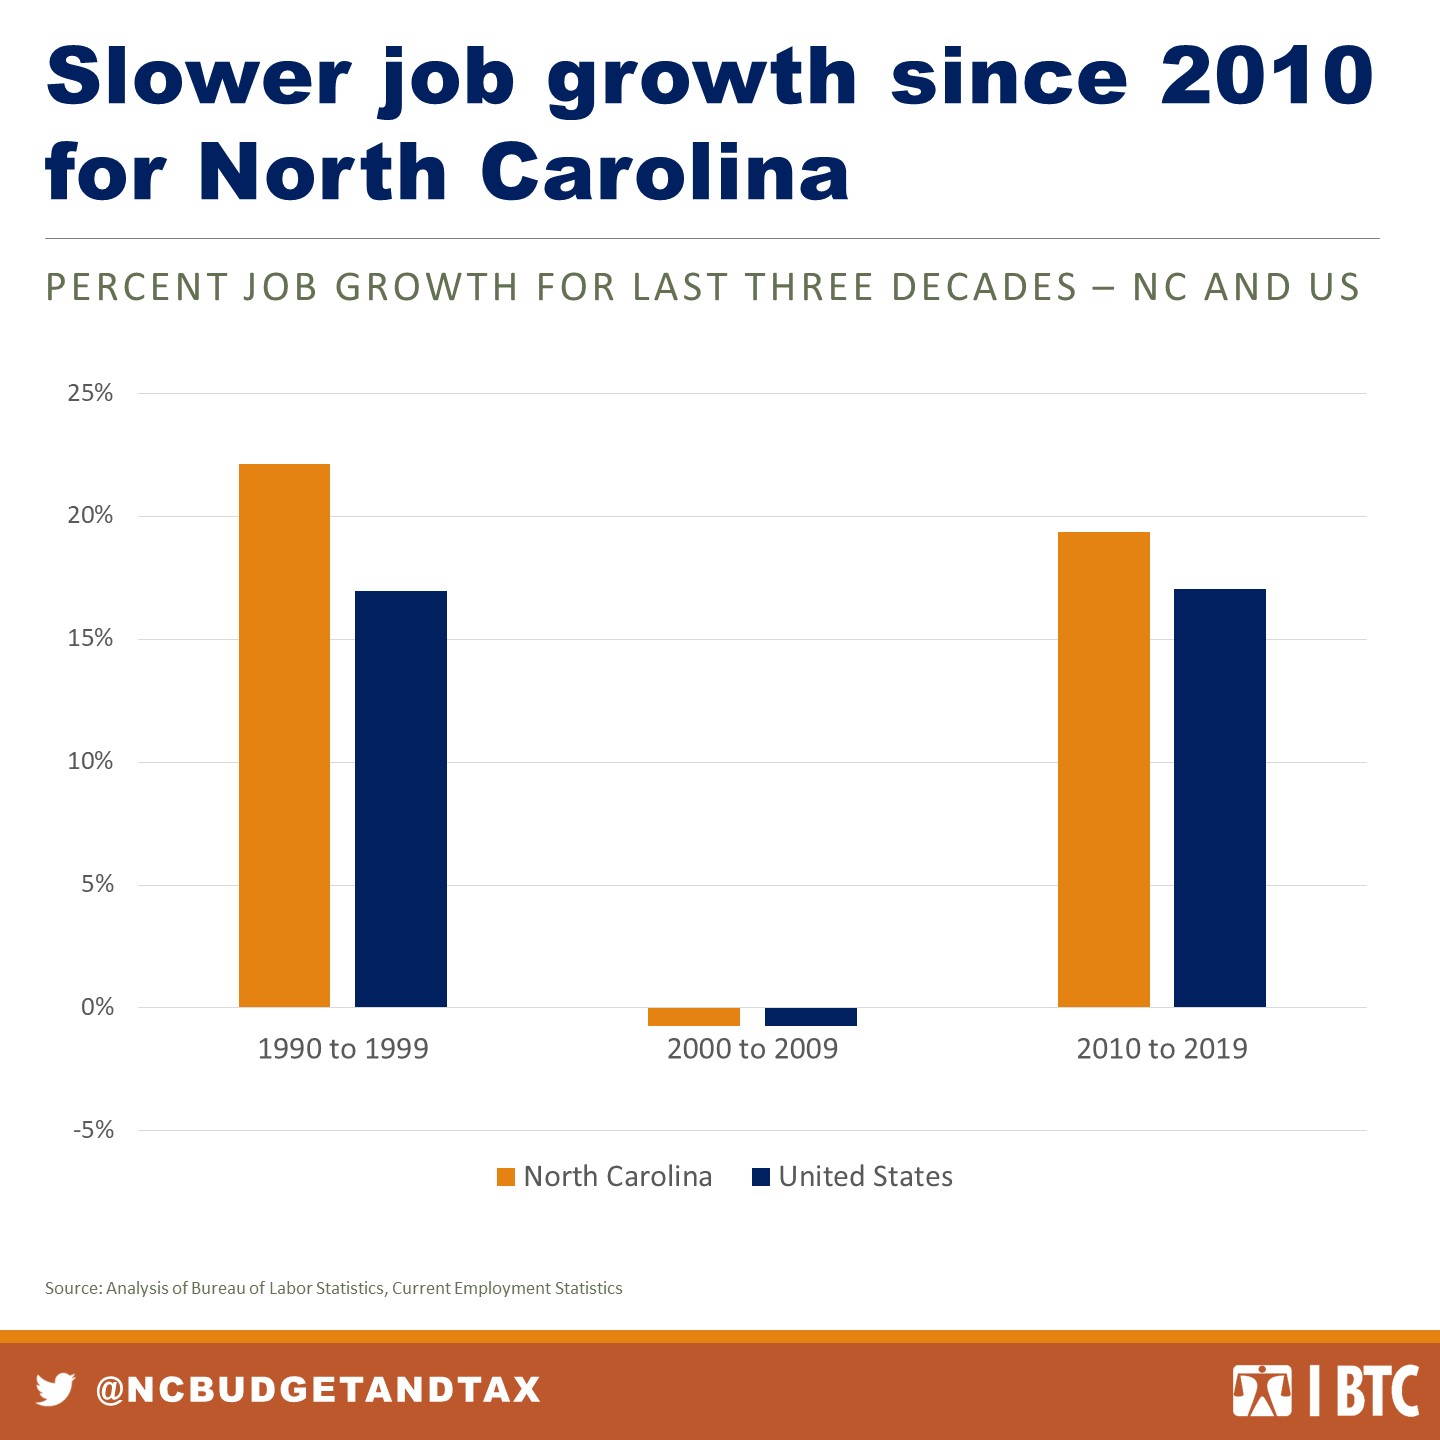
Slow overall job growth: Job growth has been slower than during the 1990s. The Great Recession erased all of the net job growth from the 2000s, but the past decade has seen weaker job growth than during the last decade of economic expansion in the 1990s
- Net job growth since 2010 has been under 20 percent, compared to 22 percent during the 1990s.
- Net job growth in North Carolina had grown dramatically faster than the national average in recent decades, a lead which has been cut in more than half since 2010. Between 1990 and 2000, employment in North Carolina expanded by over 22 percent, compared to 17 percent nationwide, meaning jobs in our state increased almost one-third faster than the national average. In the past decade however, North Carolina employment increased by 19.4 percent, only modestly ahead of the national growth rate of 17.1 percent.
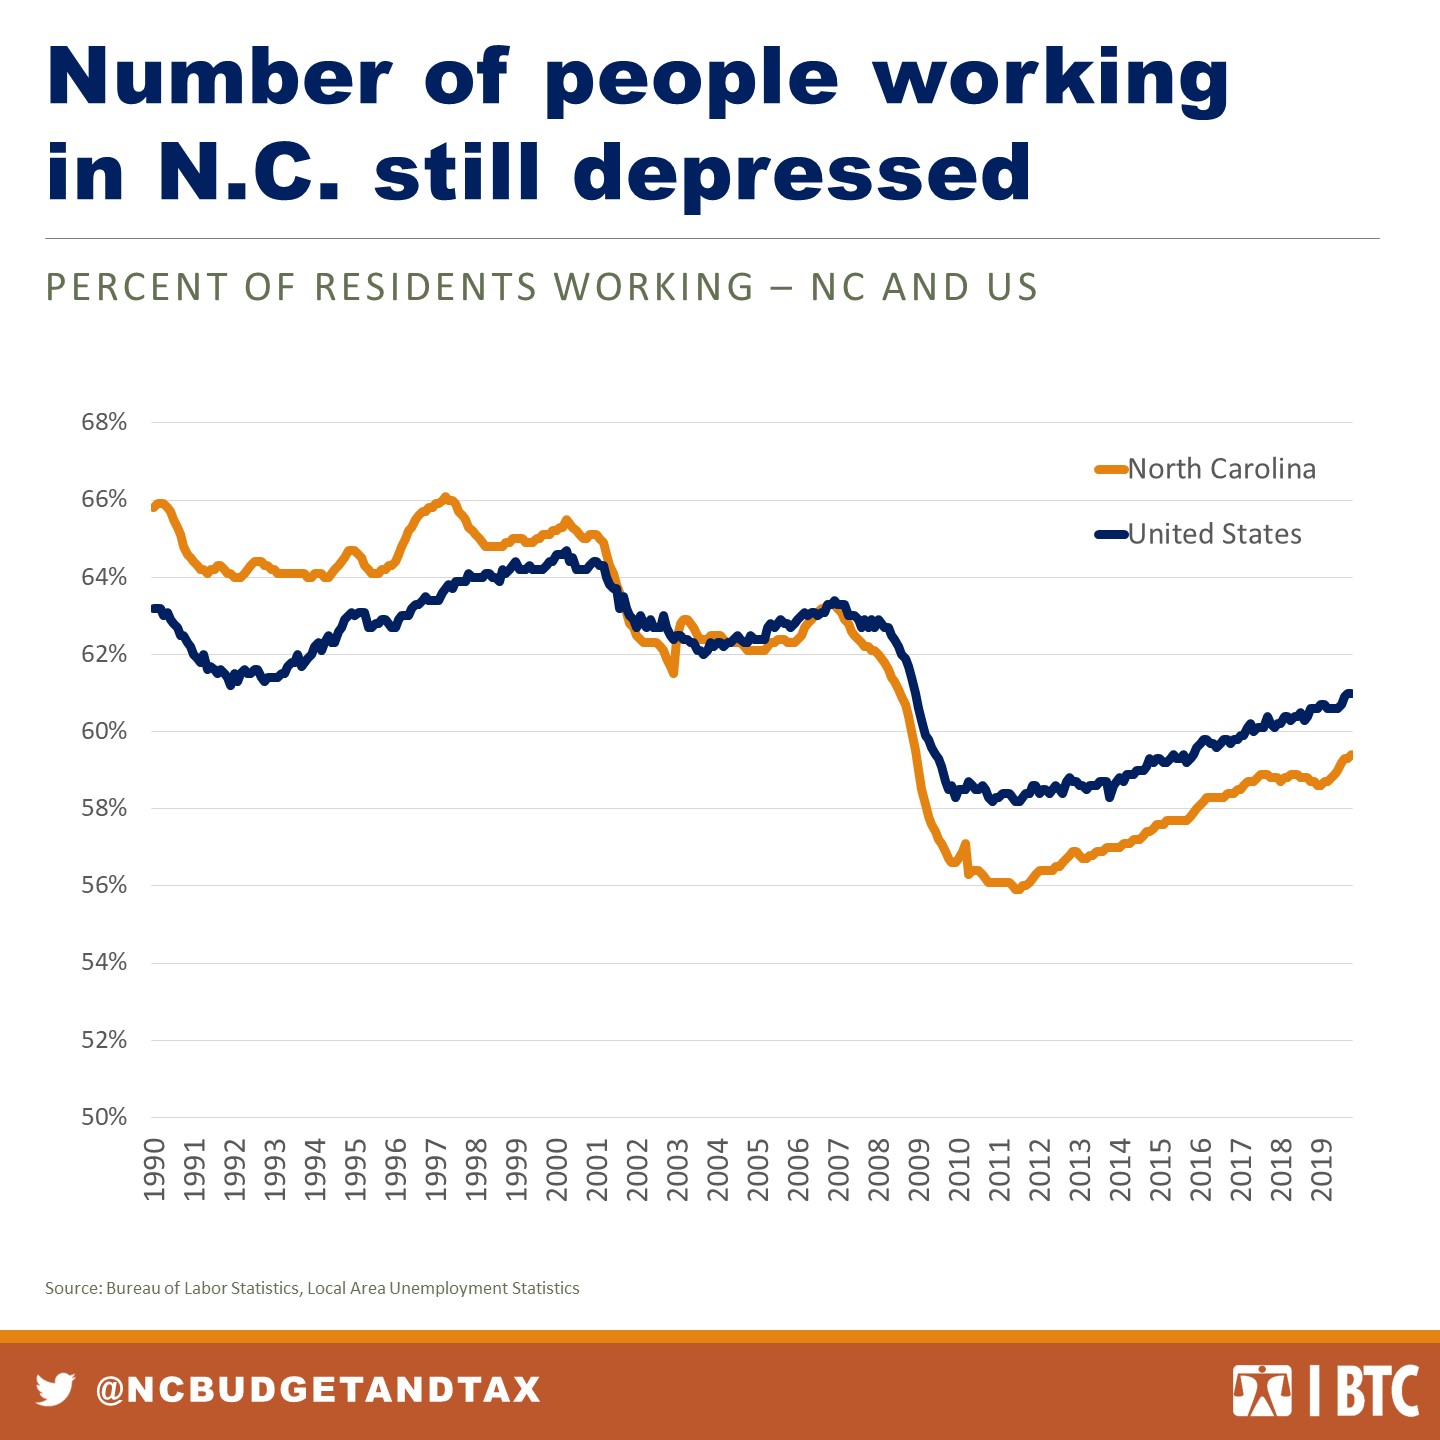
Depressed level of employment: Slow growth over the past decade has failed to return employment to historical standards. Because the headline unemployment rate does not address people who have been pushed out of the labor force, the fact that a smaller share of North Carolinians are working today than in decades past often goes underappreciated.
- At the start of the 1990s, over 65 percent of North Carolinians were in a job, compared to less than 60 percent today.
- Slow growth throughout the 2010s did not keep up with the need for jobs as the state’s population continued to expand.
- North Carolina used to beat the national rate of employment, but has been below average throughout all of the 2010s.
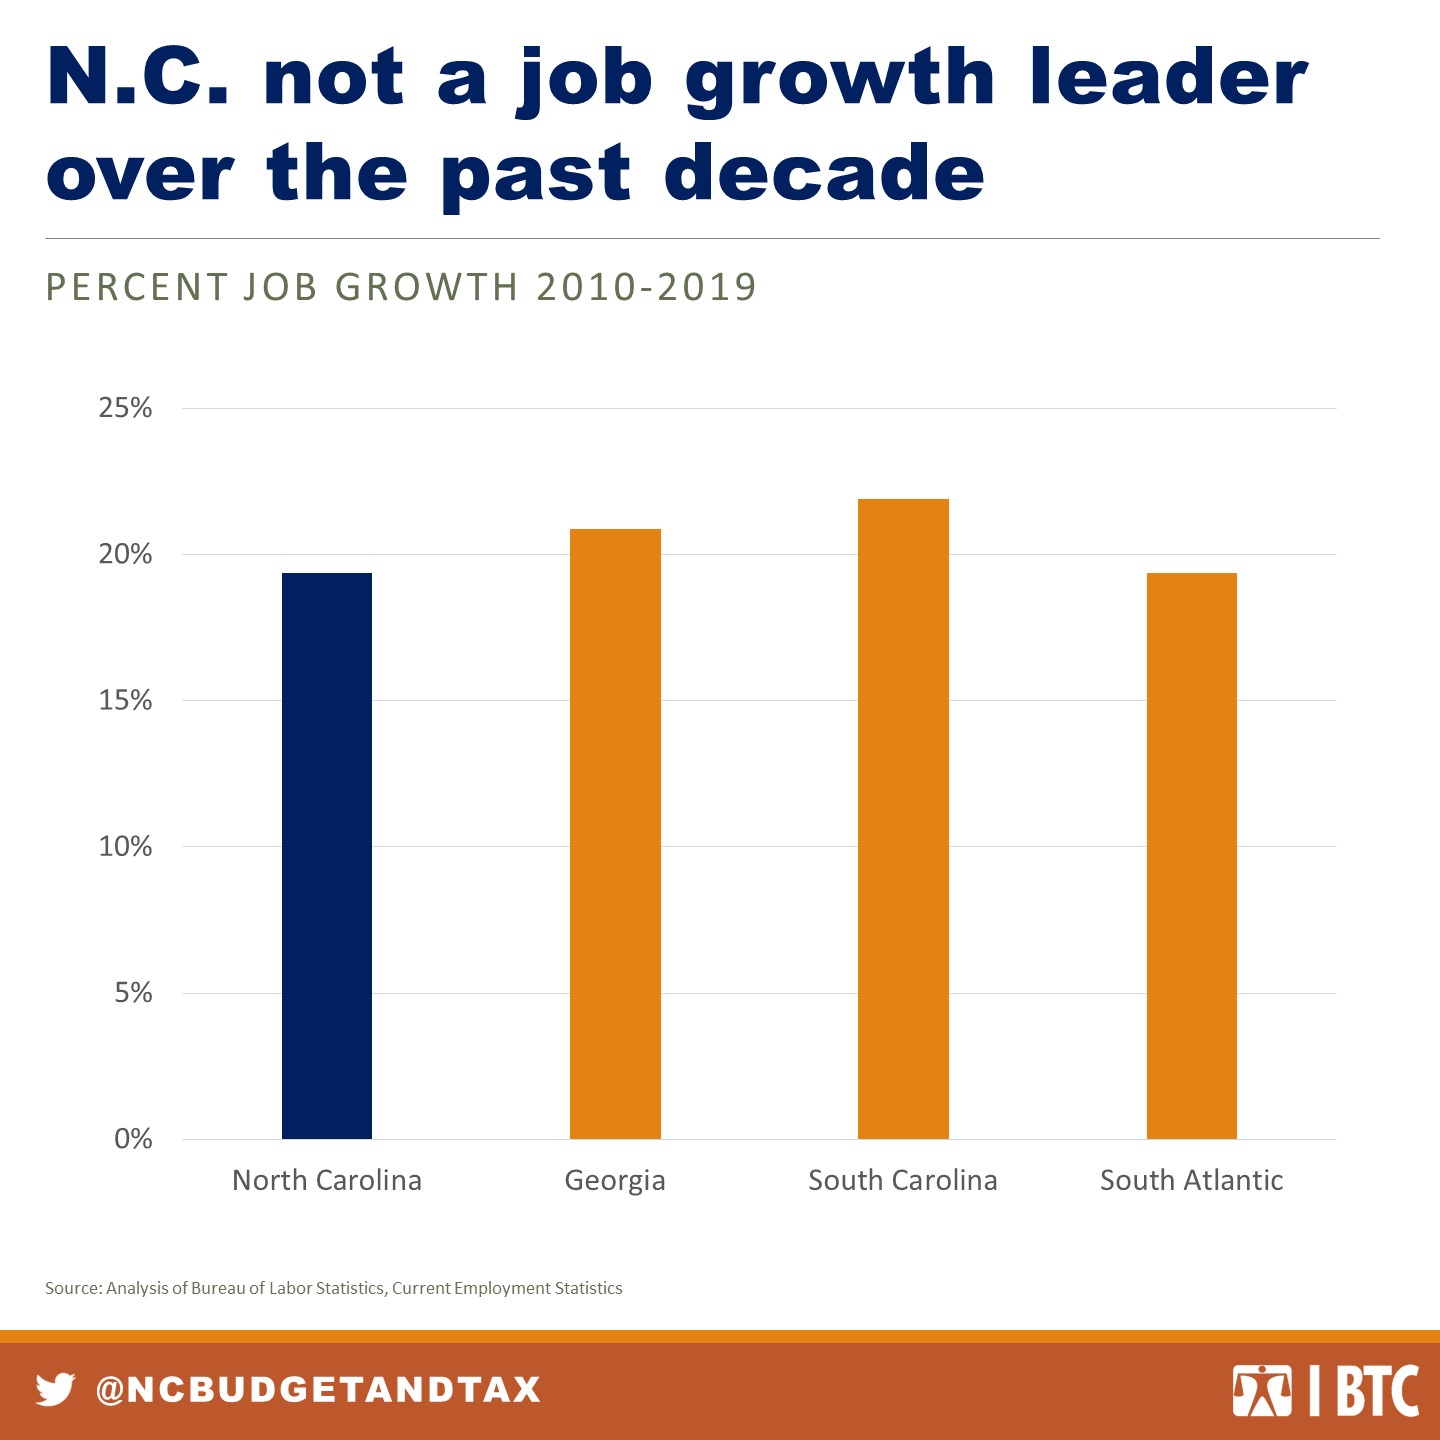
Job growth in North Carolina is lagging neighbors and national leaders: Even with a rapidly expanding population, North Carolina has not been among the national leaders in job growth.
- Job growth of 19 percent since 2010 is equal to the average for the South Atlantic region, and slower than regional neighbors Georgia, South Carolina, Florida, and Tennessee.
- Every state along the West Coast that has not followed North Carolina’s policy of cutting taxes on wealthy individuals and corporations have added jobs faster than North Carolina since 2010.
2. We’re not solving our long-term economic problems
Most of the fundamental economic problems plaguing North Carolina’s economy either continued or became even worse during the 2010s. The damage inflicted by the Great Recession may be receding, but our deeper structural problems have not been addressed. Enormous wealth concentration at the very top means most North Carolina families aren’t getting ahead, and many are struggling just to survive.
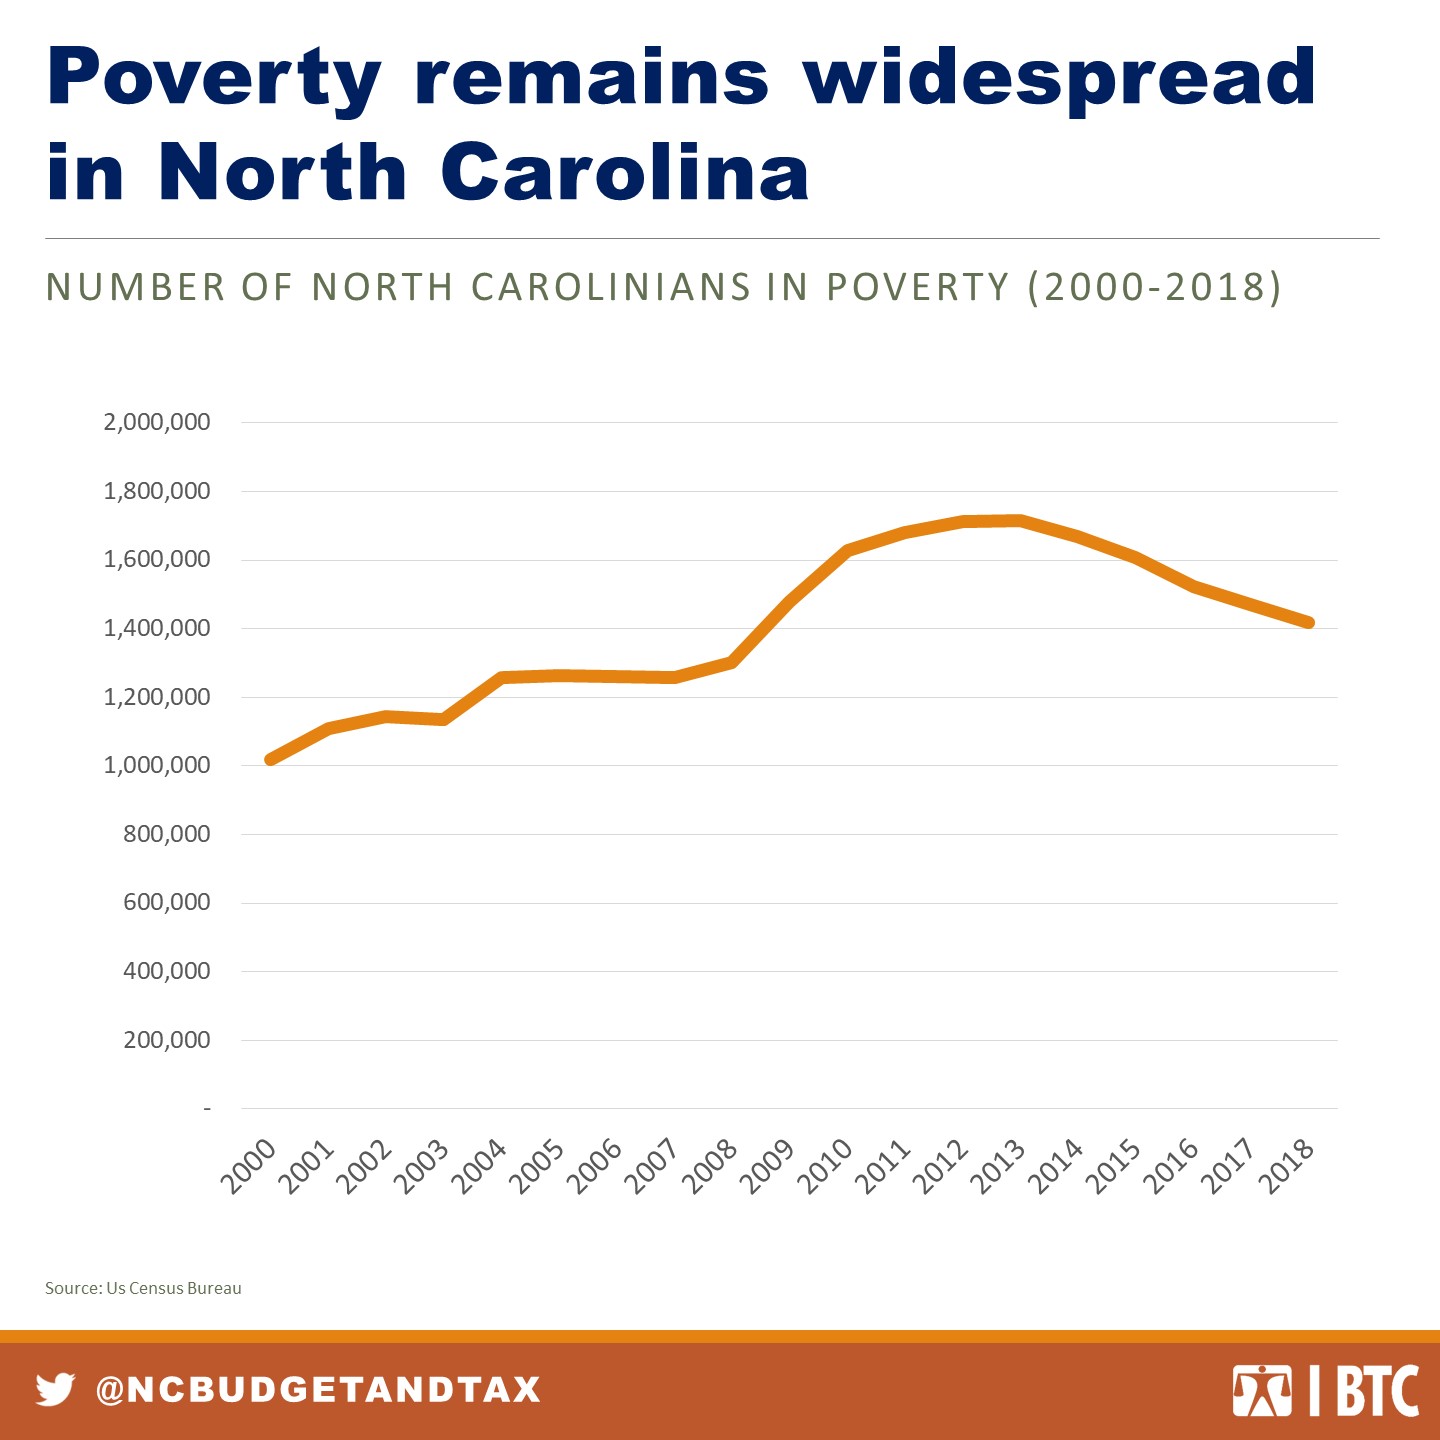
More than a million North Carolinians in poverty: The number of people living in poverty declined over the course of decade but remained above the level of poverty in 2000. Poverty creates a whole host of harms to people and communities by blocking the potential to reach full participation in the economy.
- More than 1.4 million North Carolinians lived in poverty in 2018 (most recent year available) and were forced to make impossible choices to meet basic needs.
- 1 out of every 5 children in N.C. lived in poverty in 2018.
Job growth bypassing much of North Carolina: The 2010s continued a trend of job growth concentrating in a few urban centers while many communities saw incredibly slow growth or actual loss of jobs:
- Nearly half (47 percent) of all job growth since 2010 took place in 5 metropolitan counties (Mecklenburg, Wake, Durham, Forsyth, and Buncombe).
- Nine counties lost jobs during the 2010s.
- 43 counties created jobs at a slower pace than during the 1990s.
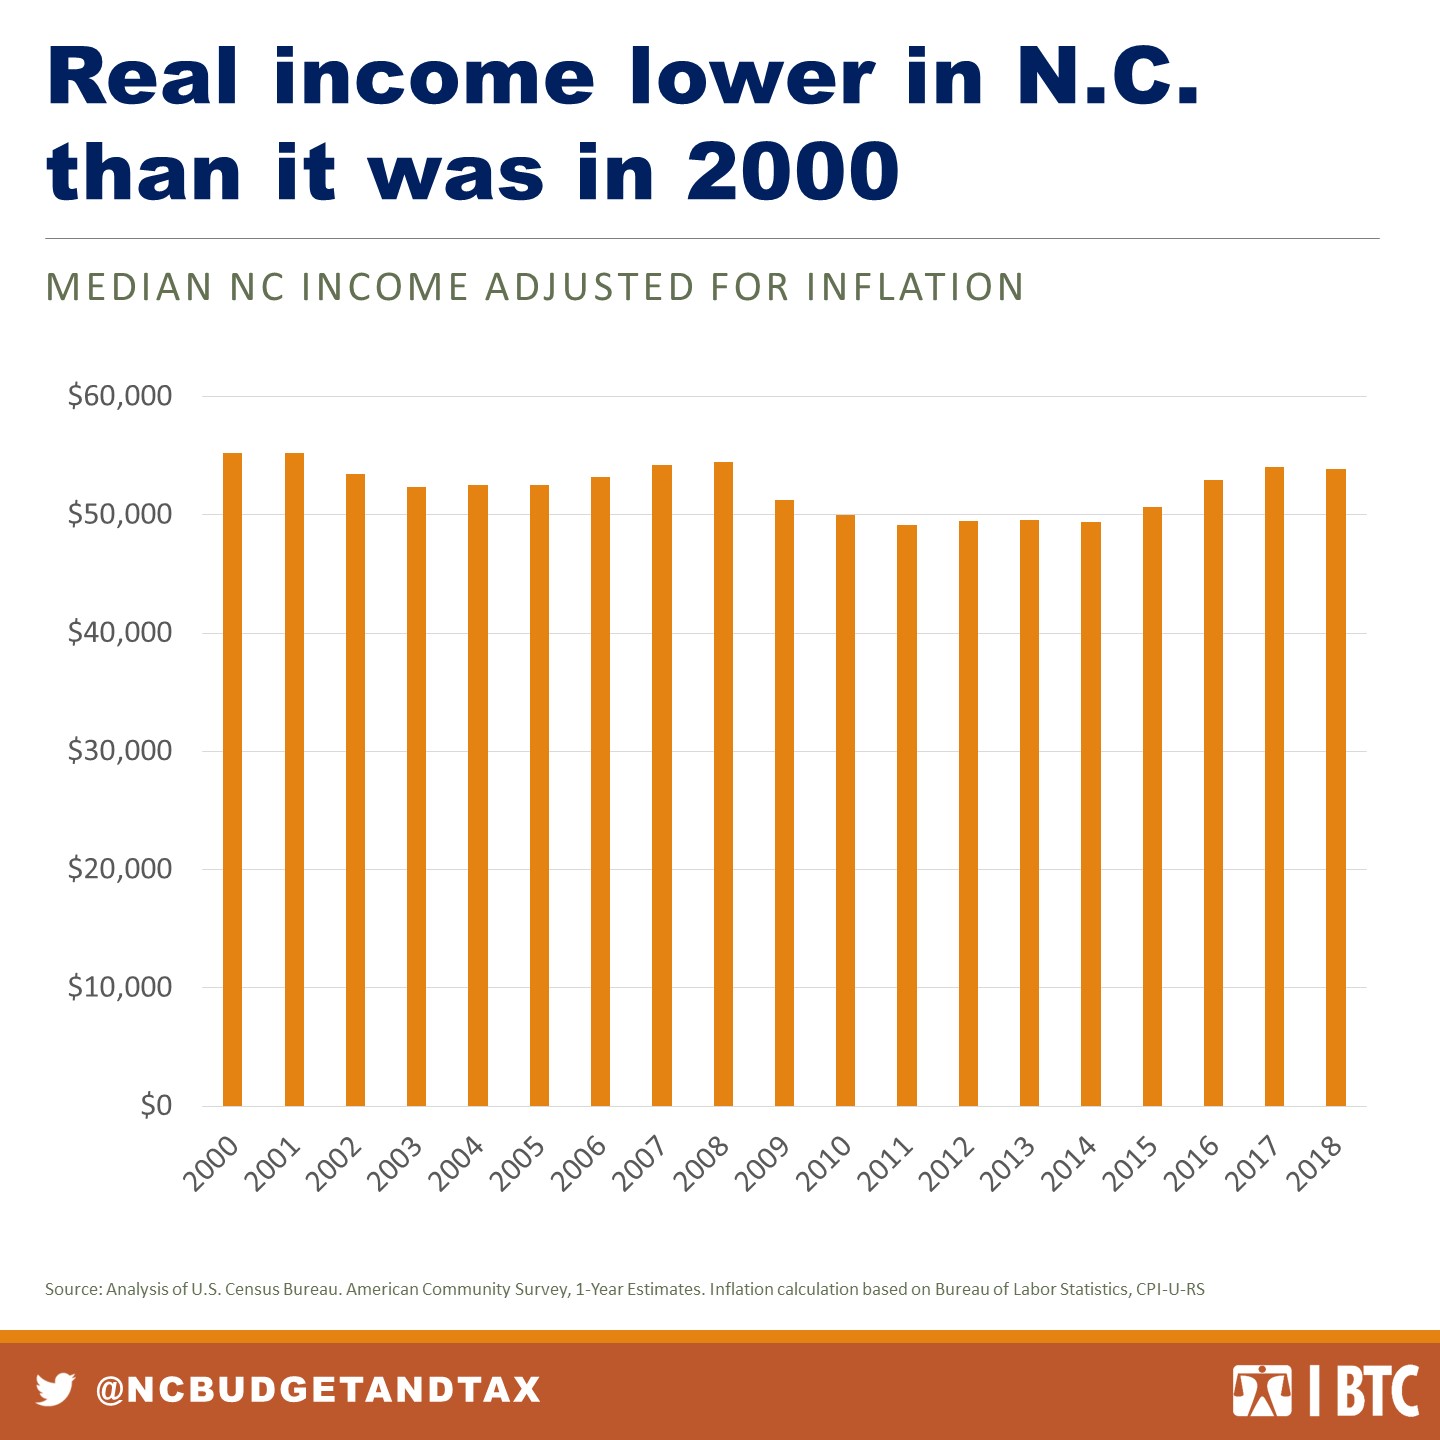
Little or no real income growth for most North Carolinians: Without growth in incomes at the median, many households will continue to struggle to afford the cost of basics. Researchers have also showed that the cost of low incomes is felt more deeply by those at the bottom of the income distribution who experience greater inflation in the cost of goods and services.
- Median household income improved slightly over the past decade but was still $1,300 lower than in 2000.
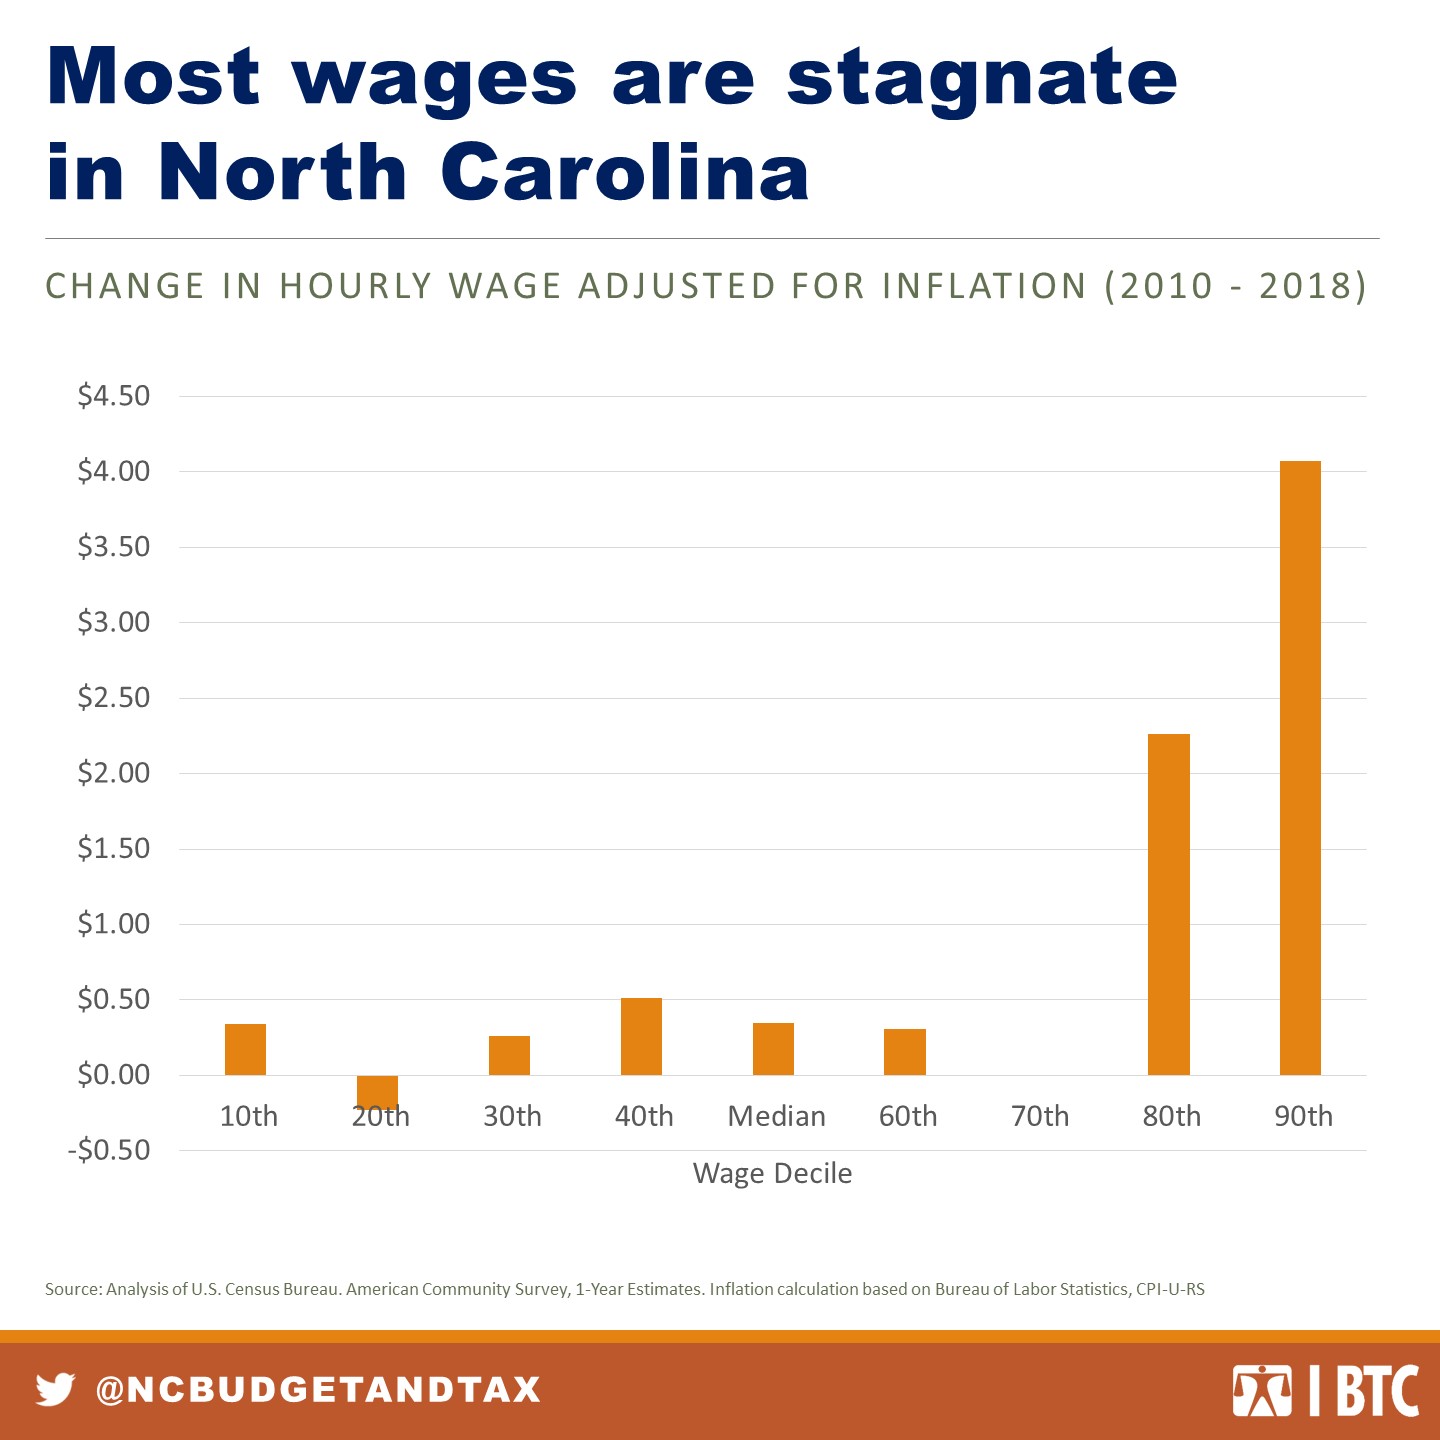
Most peoples’ wages not growing: The lack of household income growth is tied to a lack of wage growth for most working North Carolinians. Some white-collar professions at the top of the labor market have seen strong wage growth in the past decade, but most North Carolinians’ wages in 2018 (the most recent data available) didn’t buy much more than in 2010.
- Adjusting for inflation, the lowest paid 10 percent of North Carolina workers only took home 34 cents per hour more in 2018 than in 2010, and only 6 cents more than 2000.
- The best paid 10 percent of wage earners saw a real increase of over $4 per hour between 2010 and 2018.
- The bottom 80 percent of wage earners saw 50 cents or less in real hourly wage growth between 2010 and 2018.
ADDITIONAL RESOURCES
- Archive of our annual State of Working North Carolina reports at ncjustice.org/stateofwork
- Analysis of data trends and conditions at our Prosperity Watch platform at ncjustice.org/prosperitywatch
- From the Groundwork Collaborative and the Center on Poverty and Inequality at Columbia University, see The Cost of Being Poor: Inflation Inequality Leads to Three Million More People Living in Poverty
3. State spending is at historic lows despite the economic expansion
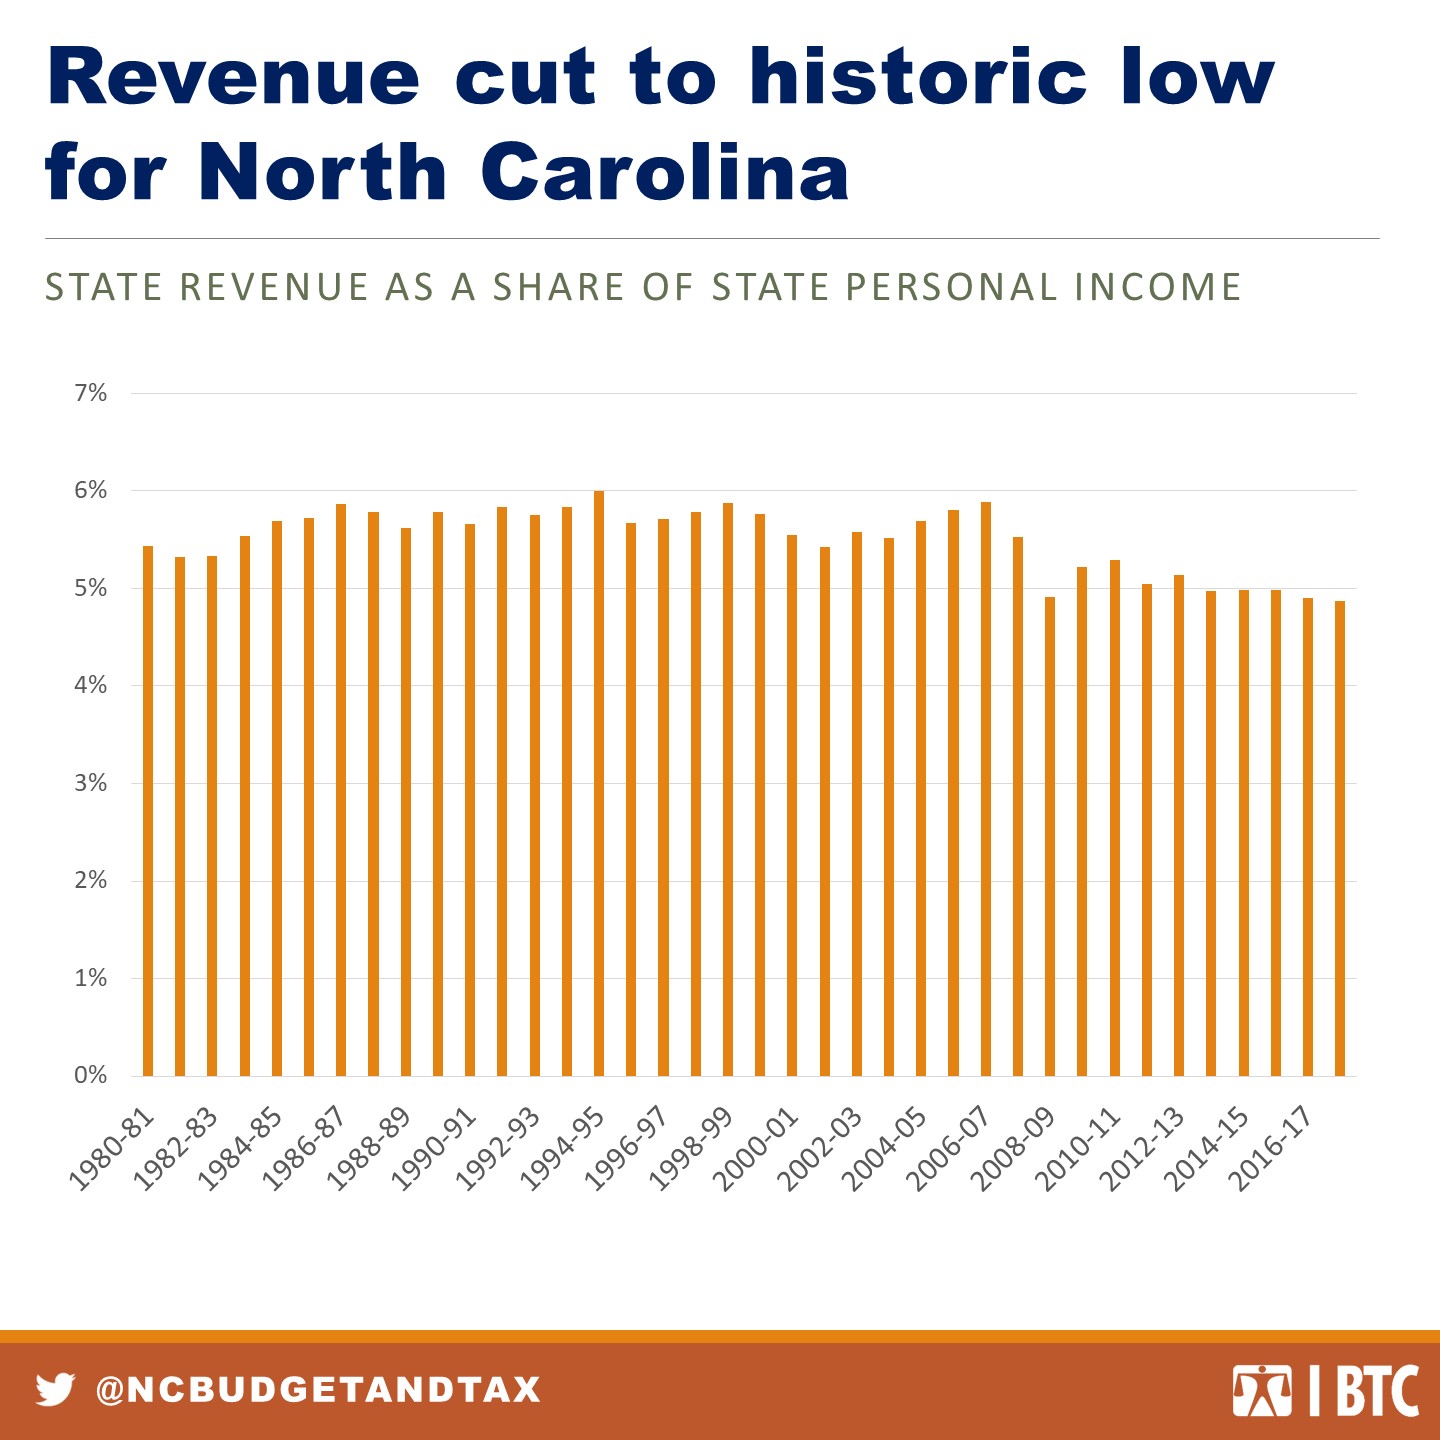
North Carolina has abandoned its historic commitment to investing for the common good. The 2010s marked a lower annualized level of public investment as a share of the state’s economy than in prior decades. This means that the state has fewer public investments supporting the growth of the economy and the state’s growing population, and that means less equitable growth and diminished access and quality of services.
State spending has decreased in the 2010s, primarily because of choices to cut taxes and reduce the state’s revenue collections for public investments. A look at tax collections as a share of the economy shows that the state’s annualized revenue growth has slowed considerably from prior levels. This ratcheting down of revenue collections as a share of the state’s economy means that North Carolina is less able to invest in our collective infrastructure that supports the well-being of our state and the sustainable growth of our economy.
Quote: “Without a strong foundation of public investments and institutions that connect people to opportunity across the state and supporting business and the broader economy to thrive, North Carolina is undercutting its potential for progress in the next decade.” — Alexandra Sirota, Director, Budget & Tax Center
4. The Class of 2021 across North Carolina will have been educated and lived under austerity budgets
Education spending has not recovered to pre-recession levels: The 2009-10 school year saw the General Assembly make massive budget cuts due to the Great Recession. But even using this year as a point of comparison, on a per-pupil basis, schools in the 2019-20 school year face:
- A 1 percent cut in classroom teachers
- A 9 percent cut in principals and assistant principals
- A 5 percent cut in instructional support staff (nurses, counselors, librarians, psychologists, social workers, etc.)
Educational resources are underfunded: Adjusted for enrollment and inflation, 13 of 19 allotments remain below 2009-10 levels due to General Assembly budget cuts, including:
- A 37 percent reduction for teacher assistants
- A 42 percent reduction for classroom supplies and materials
- A 33 percent cut to central offices, which disproportionately harms our low-income rural districts
- A 14 percent reduction in funding to support low wealth districts
- A 10 percent reduction in support for students with limited English proficiency
- The complete elimination of mentoring programs for beginning teachers
Prior to these budget cuts, North Carolina’s education system had been making steady progress. Over the past decade, however, North Carolina has fallen behind other states, and there’s been no progress in closing the opportunity gaps faced by Black and Hispanic/Latinx students.
ADDITIONAL RESOURCES
• From the Budget & Tax Center archives, see our summary of the latest tax changes at the state level and at the federal level.
• From the Institute on Taxation and Economic Policy about who pays state and local taxes.
The Budget and Tax Center conducts non-partisan analysis of state budget and tax policy and monitors economic conditions in the state. We produce timely and accessible research that contributes to policy discussions and public debate, with the goal of building a broader understanding of the role of policy in supporting economic opportunity for all.